Errors are bound to happen. Even with an observability tool, finding the source of an error isn't as straightforward as you might assume. Think about a flooded yard. You notice water flowing near your hose, but the cause of the flood is actually a crack somewhere in your water main. If you assumed that the leaking hose caused the flood, you'd end up with a fixed hose but a ruined lawn: a costly mistake.
Error analysis takes you to the source of the issue so you can fix the issue before the flood happens. When a team makes a new deployment or a service fails upstream, you need to dig deeper before implementing any solutions. There's no room for assumptions in error analysis.
Objectives
This tutorial series shows you how to solve critical errors, then guides you into reducing your overall error count. This doc covers how to navigate our errors inbox feature, including how to:
- Choose a service to begin error analysis
- Choose an error group that indicates an outage
Prerequisites
To monitor your application's performance, you'll use an agent created specifically for your app's language. Clicking a logo sends you to a guided installer in the New Relic UI where you'll be guided through installing and configuring the agent.
Once you've installed an agent, go to one.newrelic.com and select your app. If you don't see much data just yet, step away for a while and let the agent gather real-time data as your application runs. This tutorial also assumes you have some familiarity with , even if you haven't yet created your first alert.
Detect and track errors in your application
Now that your apps are instrumented, New Relic is capturing data about your services. This includes data about error occurrences in your app.
Think about the end user
Alerts let you know a problem exists: they're the water on your lawn. But alerts won't provide you all the context. That's where your errors inbox comes in.
Imagine you're responsible for some apps on an ecommerce site. You've received two alerts for two components, one for checking out and one for searching inventory. You're only receiving reports that the search functionality is failing for end users, but the check out component works fine. You may believe that the check out function is more important, but it's critical to separate your beliefs from your observability practices.
This practice applies even if the end user hasn't reported anything. When you notice services failing, you can ask yourself these questions:
- Is the end user experiencing a problem?
- How should their experience look?
- What behavior are they currently experiencing?
Determine what services are reporting errors
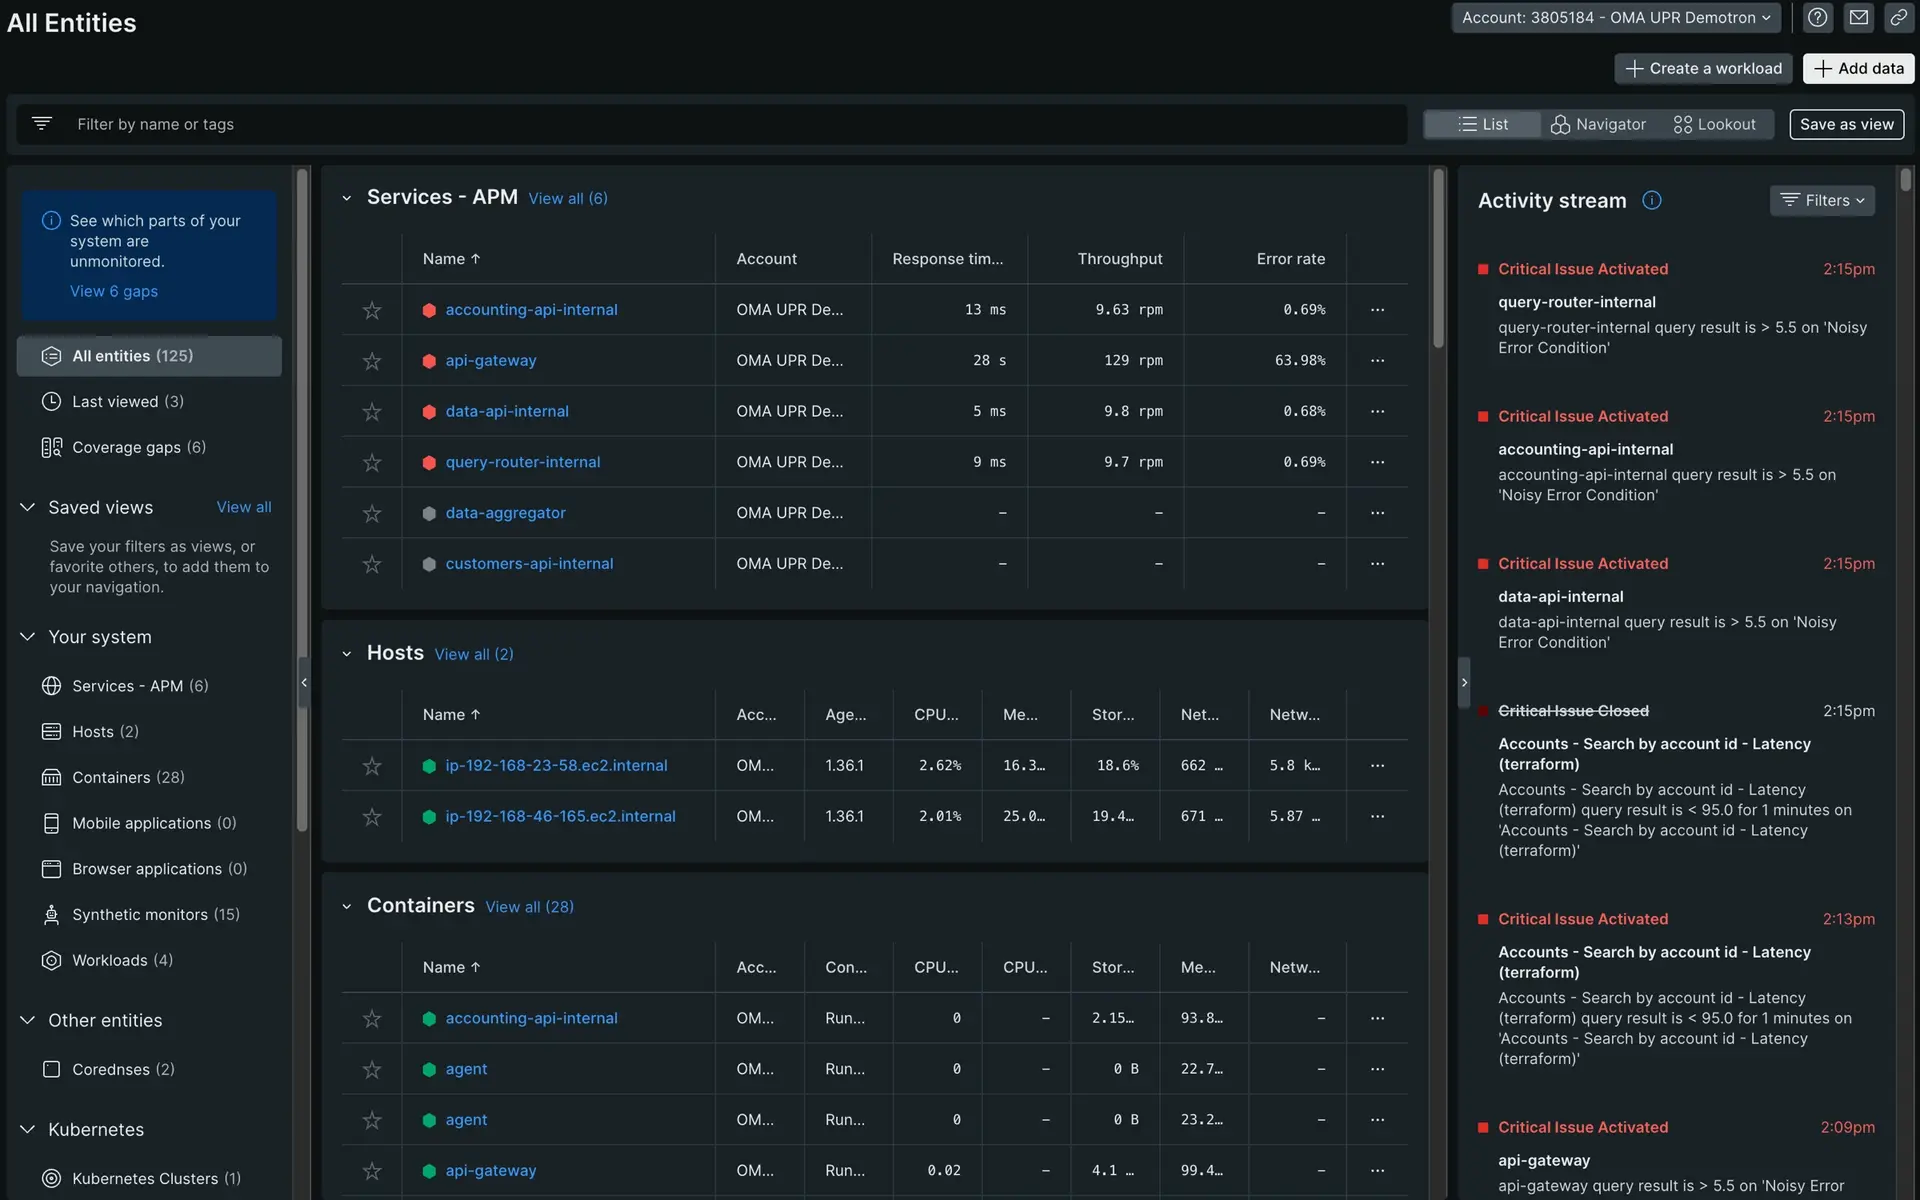
Let's see how this might look in practice. When you view the All entities page, you notice four services are alerting.

After asking yourself the questions from step one, you know that:
The end user is struggling with purchase actions.
Your site should only display in-stock items.
Your site is displaying all products, so customers are able to purchase out-of-stock items.
You've identified that
api-gatewayis a critical dependency for your inventory. This is where you'll begin your error analysis.
Locate what changed
You have your entry point into your system, so now you can look into the errors affecting your app. From the api-gateway summary page, click the Errors tab under Triage. Your errors page filters your data to an errors-only view.

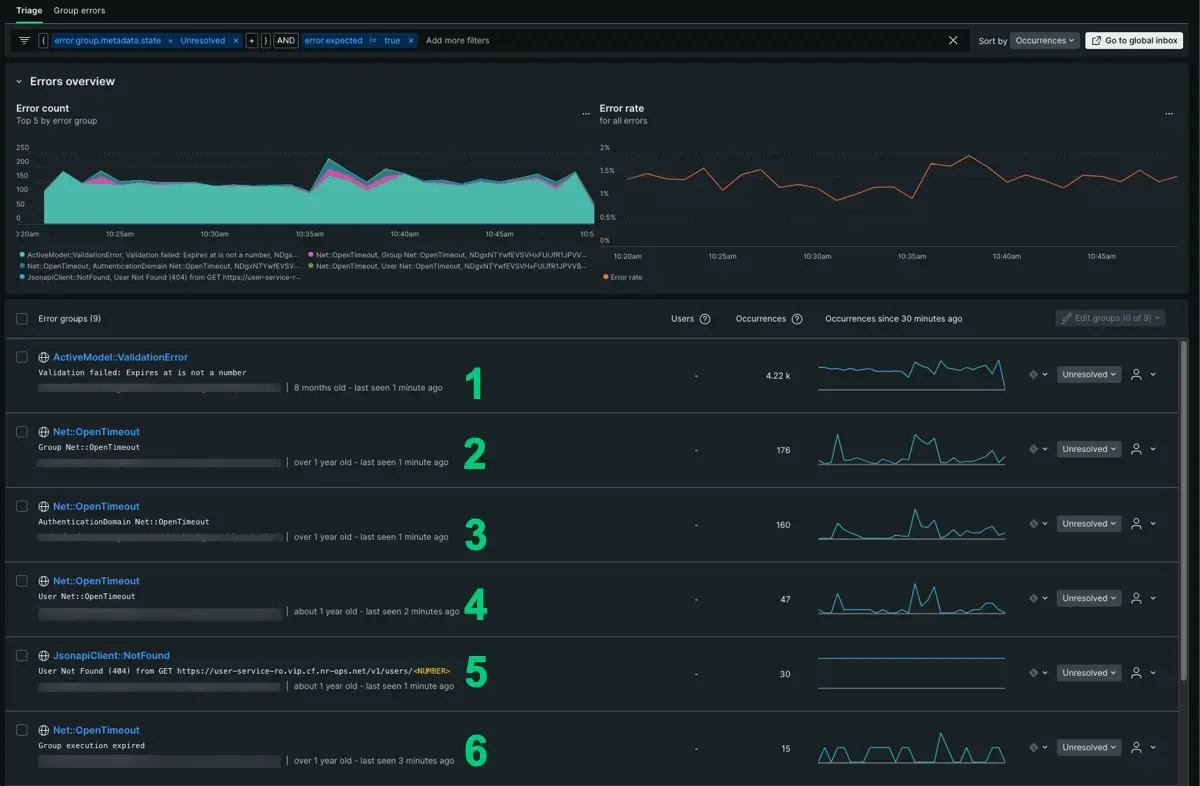
There are at least six error groups reporting in api-gateway. The error groups appear anywhere from a dozen to thousands of occurrences in your app.
At first this seems to lack granularity, but your time series gives you enough information to point to what changed over time. We'll break this down:
- Based on number of occurrences alone, your first instinct might tell you to start with
ActivemModel:::ValidationErroras it has 4,000 occurrences. If you look at the time series, though, its peaks and troughs are relatively consistent. This could be an expected error, but let's look at the other five. - The
Net::OpenTimeOuterror group has a similar pattern, and it actually makes up four of the six reporting groups. Across each error group, you can see consistent peaks and troughs that extend before the incident. With the same name and similar patterns, we can infer this is an expected error as well. - Our last option is
JsonapiClient:::Notfound. LikeActivemModel:::ValidationError, it has a distinct shape and is consistently reporting. While it doesn’t have many occurrences, the time series is anomalous enough that it might be worth digging a bit deeper.
Adjust the time series
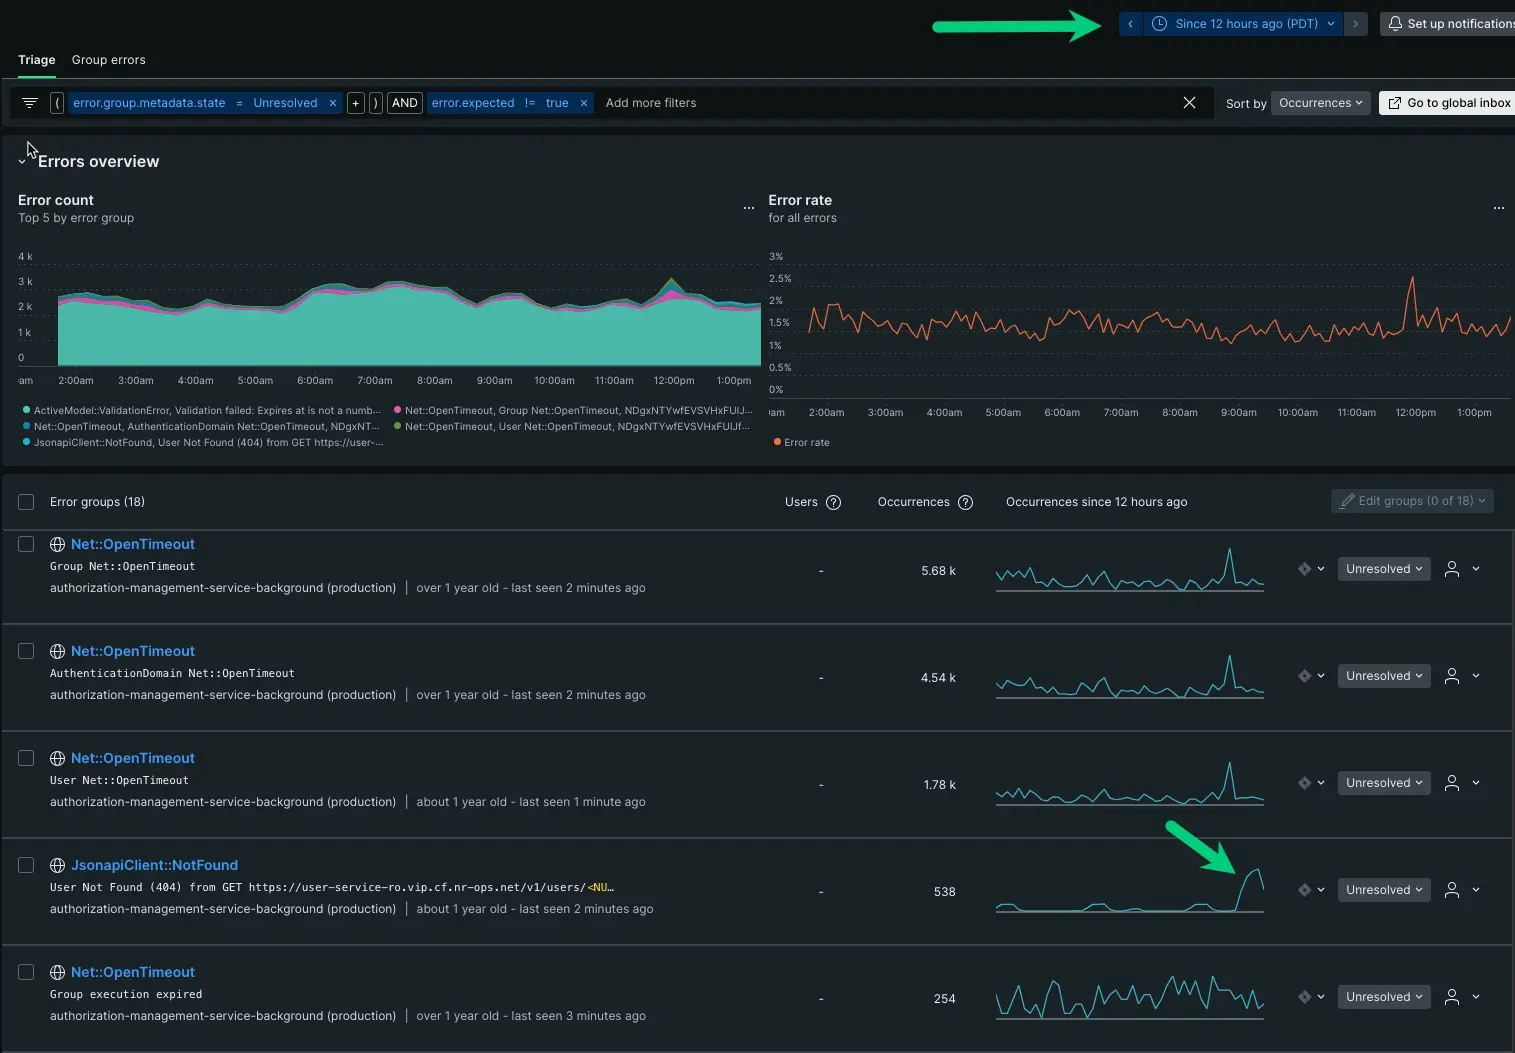
To be certain, adjust the time parameter to show patterns from the last 12 hours:

With the adjustment, you see that ActivemModel:::ValidationError has an unchanging pattern of peaks and troughs, but your JsonapiClient:::Notfound increased dramatically in the last hour. This is a good starting point.
Knowing when something happened is a critical piece for getting closer to the source. Having a complete understanding of the problem space, you can now dig into the source.