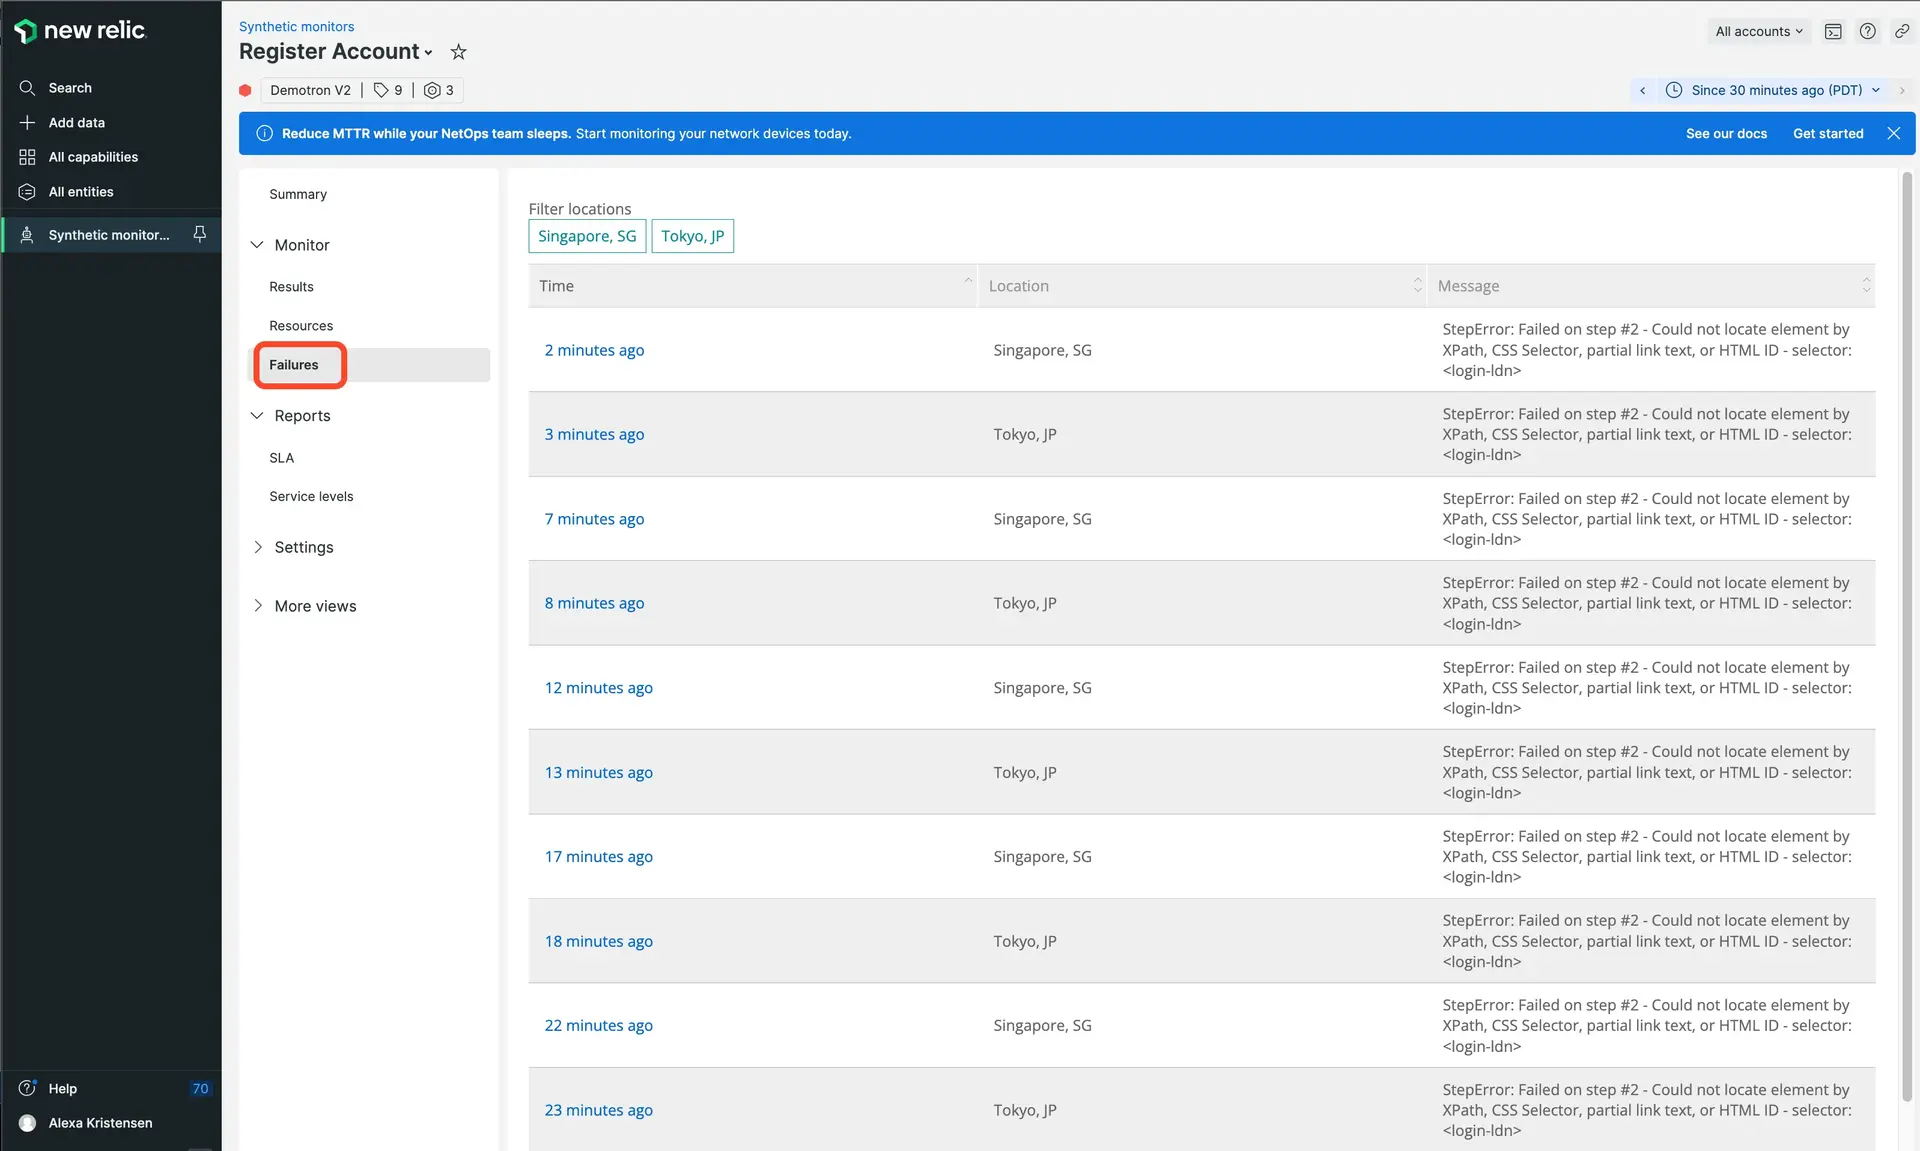
Use the Failures page to locate and troubleshoot downtime alert events or other errors. A downtime alert event occurs whenever a monitor fails to completely execute. For example, a ping monitor is "down" when the GET request fails, while a scripted browser monitor is "down" if any part of the script fails to execute. After locating an interesting downtime, select it to view detailed results from that downtime alert event and troubleshoot.
View the failures page
To access your monitor's failures: one.newrelic.com >Synthetic monitoring > (select a monitor) > Failures.

Hover the mouse over a failure to get quick data about it. Click on the dot to open a detailed report of the failure. You can also click Run check to recheck the failed monitors.
View individual downtimes
You can select individual downtime alert events to view them in more detail. Depending on the specific failure, a downtime result could include only the server error message (such as Server replied with "HTTP 500" error), or a full or partial waterfall view.
Downtime results include waterfalls when only part of a monitor executed correctly. For example, a 301 redirect could link to a failing web page. The browser correctly executes the redirect, but the destination web page returns an error. Use the error message or waterfall to troubleshoot the downtime alert event.
Use page functions
The Failures page supports the following features:
If you want to... | Do this... |
|---|---|
Sort the list of downtimes | In the table header, select Time or Message to sort the list. Select Time or Message again to change from ascending sort to descending sort order. |
Filter by location | Select a location label to hide downtime alert events from that location. Select the location label again to unhide those results. To view results from only one location, hide every other location. |
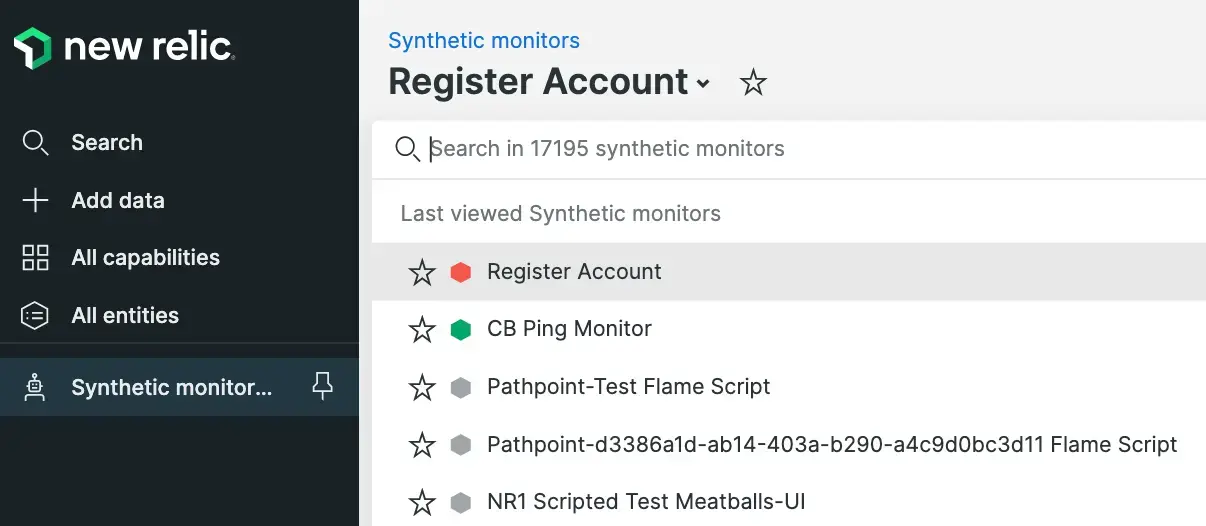
Quickly access another monitor | |
Change the time frame | Use the time picker to adjust the number of downtime alert events returned. |
Avoid extra noise and get notified after three failures | Read our blog post on the three strikes rule. |
