Monitor Apache Airflow data by configuring OpenTelemetry to send data to New Relic, where you can visualize tasks, operators, and DAG executions as metrics.

Prerequisites
Before enabling OpenTelemetry in Apache Airflow, you'll need to install the Airflow package with the otel extra. The installation method depends on your Airflow deployment approach:
Option 1: Installing from PyPi
Follow the installation instructions from Airflow's Documentation.
When installing with pip, add the
otelextra to the command. For example:bash$pip install "apache-airflow[otel]"
Option 2: Installing from Docker
Set up the Airflow Docker image using instructions from Airflow's documentation.
Extend the pre-built Docker image by using a Dockerfile to install the
otelextra. You can replace the latest tag with your desired version of the image.FROM apache/airflow:latestRUN pip install --no-cache-dir "apache-airflow[otel]==$AIRFLOW_VERSION"
Dica
$AIRFLOW_VERSION is already set by the apache/airflow container, but can be replaced with a version number for other base images.
Configuration
To send Airflow metrics to New Relic, configure the OpenTelemetry metrics to export data to an OpenTelemetry Collector, which will then forward the data to a New Relic OTLP endpoint using a .
Importante
Due to Airflow's current lack of support for sending OpenTelemetry data with authentication headers, the OpenTelemetry Collector is essential for authenticating with New Relic.
Configure the OpenTelemetry Collector
- Follow the basic Collector example to set up your OpenTelemetry Collector.
- Configure the Collector with your appropriate OTLP endpoint, such as
https://otlp.nr-data.net:4317. - For authentication, add your to the environment variable
NEW_RELIC_LICENSE_KEYso that it populates theapi-keyheader. - Ensure port 4318 on the Collector is reachable from the running Airflow instance. (For docker, you may need to use a docker network.)
- Launch the Collector.
Configure Airflow metrics
Airflow sends metrics using OTLP over HTTP, which uses port 4318. Airflow has multiple methods of setting configuration options.
Importante
If your environment has Airflow running in a docker container alongside the OpenTelemetry Collector, you will need to change the otel_host setting from localhost to the container address of the Collector.
Choose one of the following methods to set the required options for Airflow.
Set the required options in the
airflow.cfgfile.[metrics]otel_on = Trueotel_host = localhostotel_port = 4318otel_ssl_active = FalseOr, set the required options as environment variables.
bash$export AIRFLOW__METRICS__OTEL_ON=True$export AIRFLOW__METRICS__OTEL_HOST=localhost$export AIRFLOW__METRICS__OTEL_PORT=4318$export AIRFLOW__METRICS__OTEL_SSL_ACTIVE=False
Dica
Airflow has additional settings for metrics that may be useful. This includes the ability to rename metrics before sending, which is helpful if metric names exceed the 63 byte limit for OpenTelemetry.
Validate data is sent to New Relic
To confirm New Relic is collecting your Airflow data, run a DAG or pipeline:
- Login to Airflow.
- Click the run button on one of the existing tutorial DAGs, or your own.
- Wait for the pipeline to finish running.
- Go to one.newrelic.com > All capabilities > APM & services > Services - OpenTelemetry > Airflow.
- Click Metrics Explorer to visualize metrics for pipeline executions.
Building dashboards
With Airflow metrics, you can build dashboards around individual pipelines, overall performance, or view a comparison between different pipelines. Click here to learn more about querying your metrics.
This query retrieves a list of all reported metrics for Airflow:
SELECT uniques(metricName) FROM Metric WHERE entity.name = 'Airflow' AND metricName LIKE 'airflow.%' SINCE 30 MINUTES AGO LIMIT 100Make sure to change the limit (100) if your metric names exceed it.
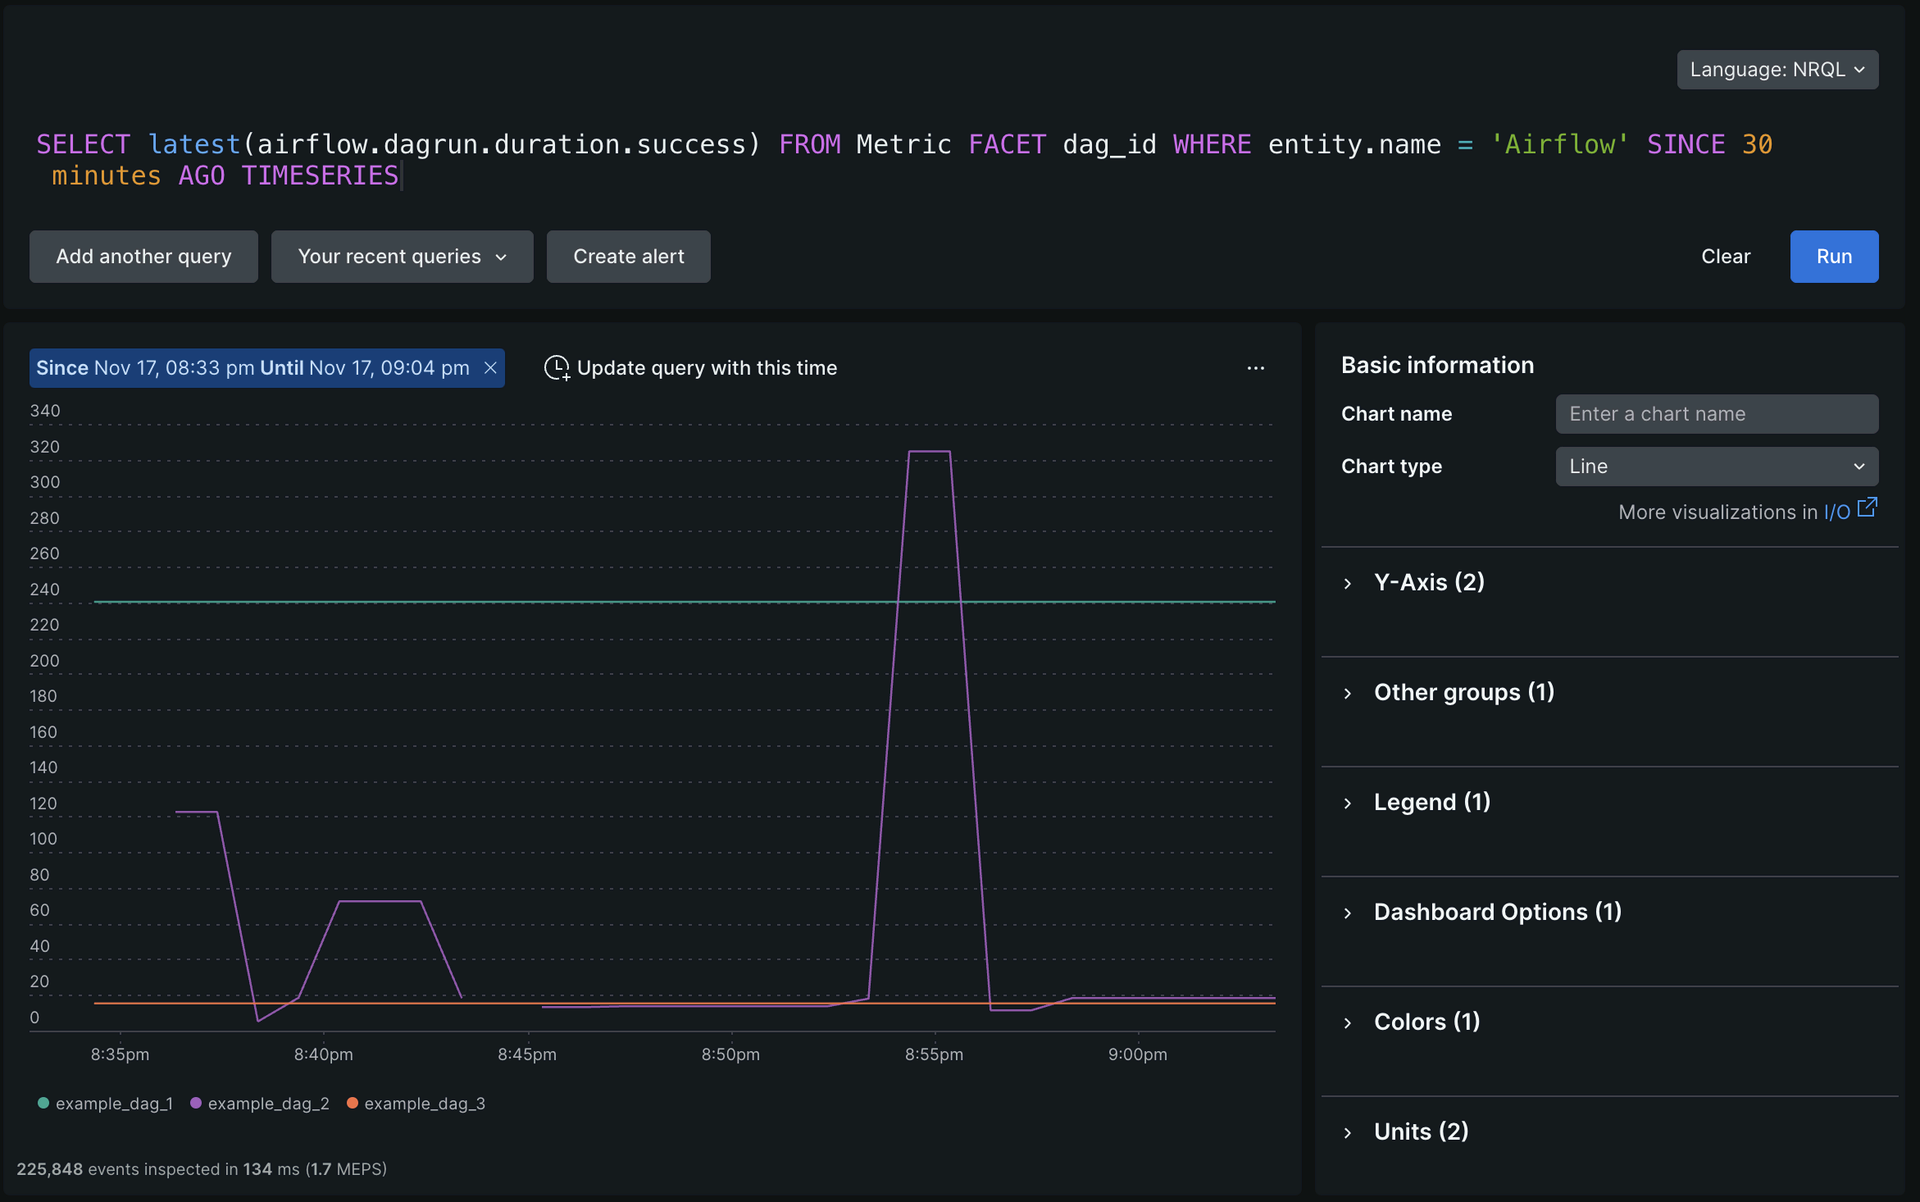
This query shows a comparison of different completion times for successful runs of different DAGs:
SELECT latest(airflow.dagrun.duration.success) FROM Metric FACET dag_id WHERE entity.name = 'Airflow' SINCE 30 minutes AGO TIMESERIES
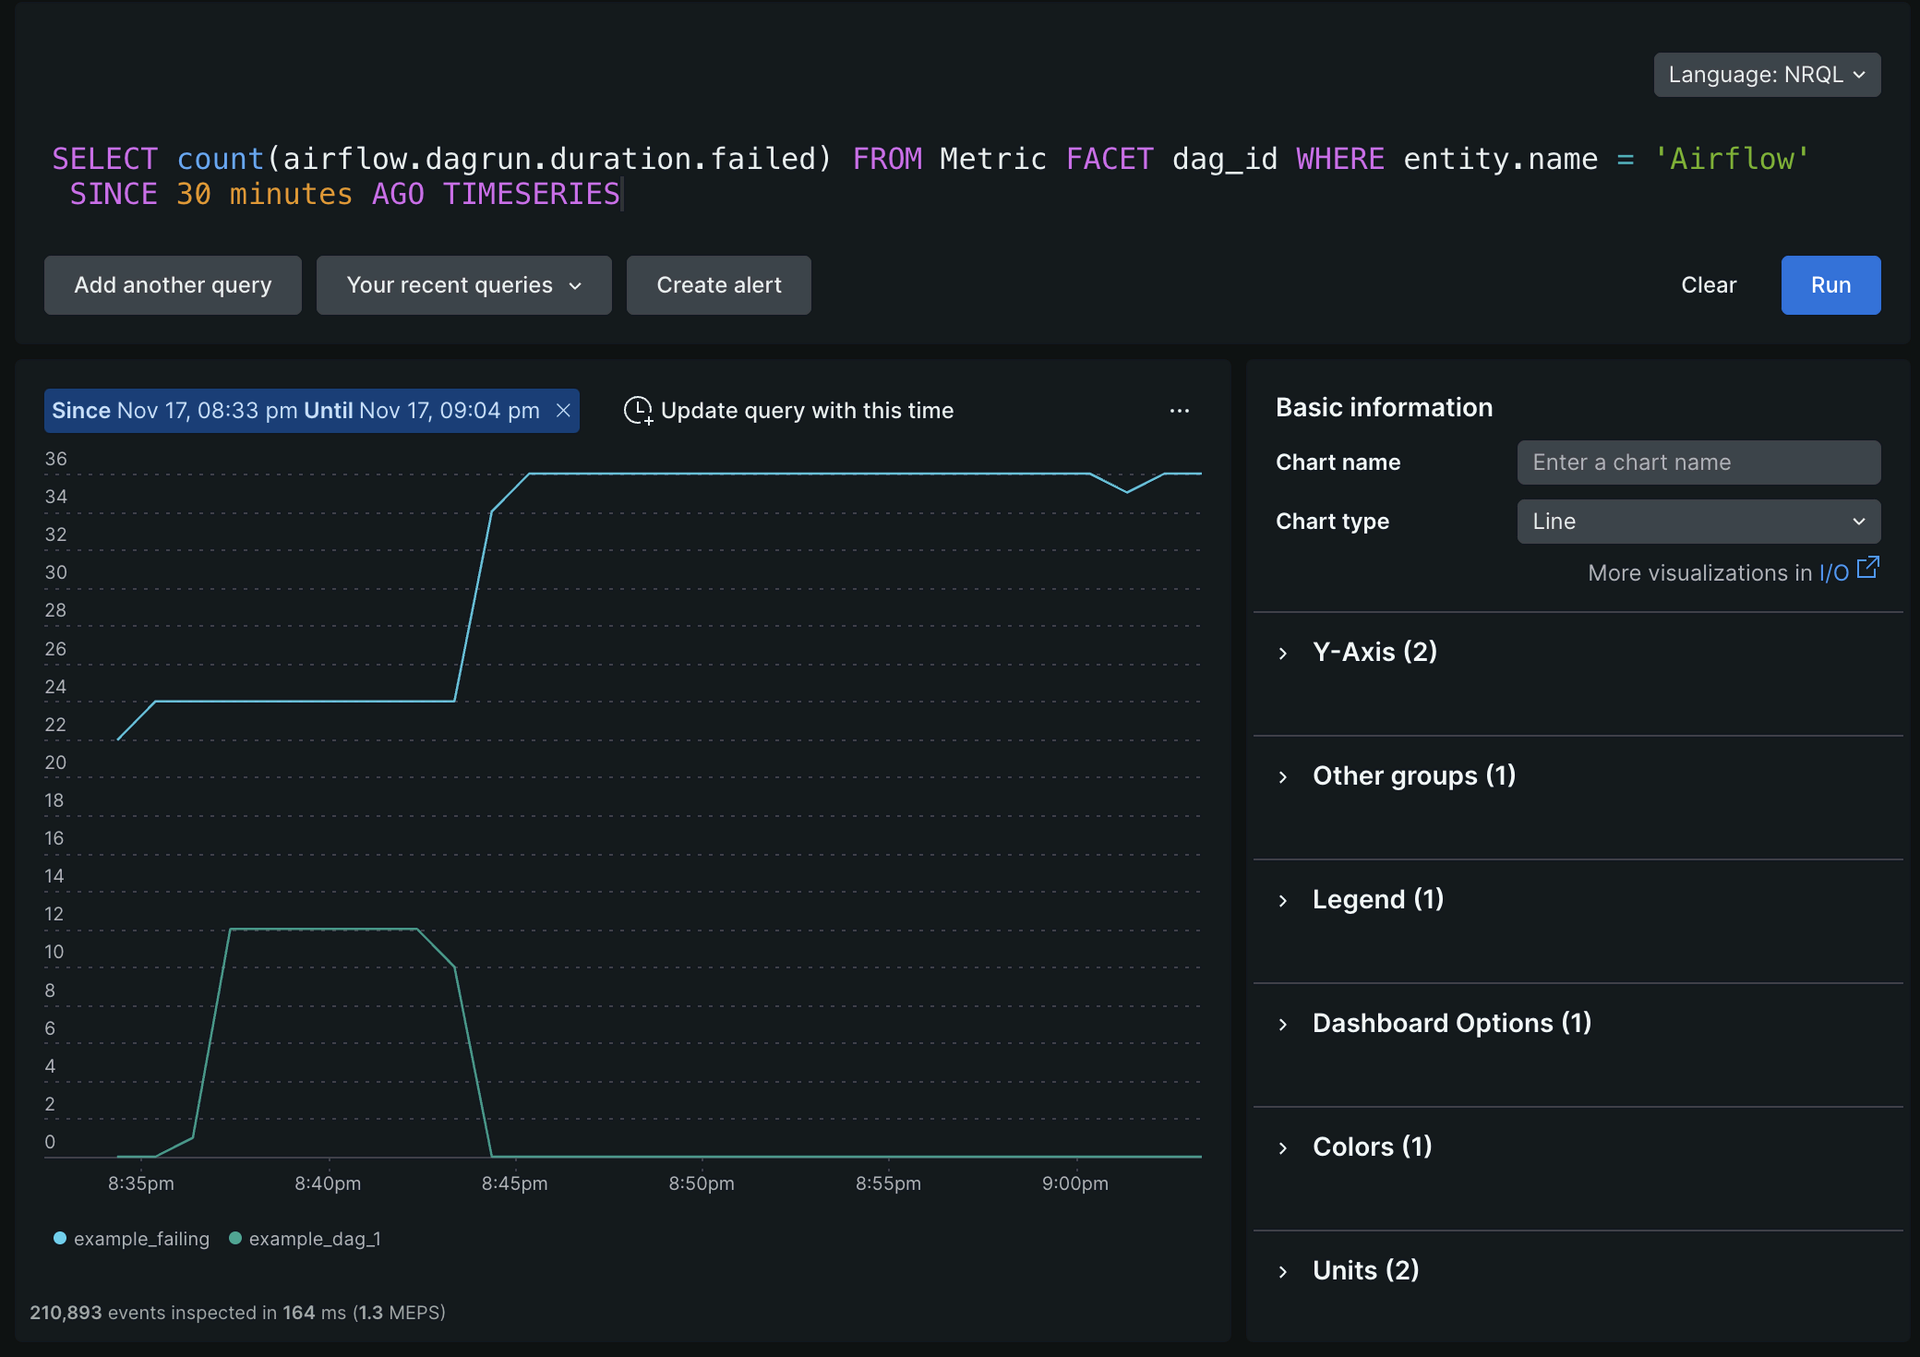
This query shows counts of failed DAG runs, which can be used to build for critical pipelines:
SELECT count(airflow.dagrun.duration.failed) FROM Metric FACET dag_id WHERE entity.name = 'Airflow' SINCE 30 minutes AGO TIMESERIES
Importante
Airflow's OpenTelemetry metrics are not maintained by New Relic, so if you have any issues with the instrumentation, create a new issue in Airflow's GitHub repo.