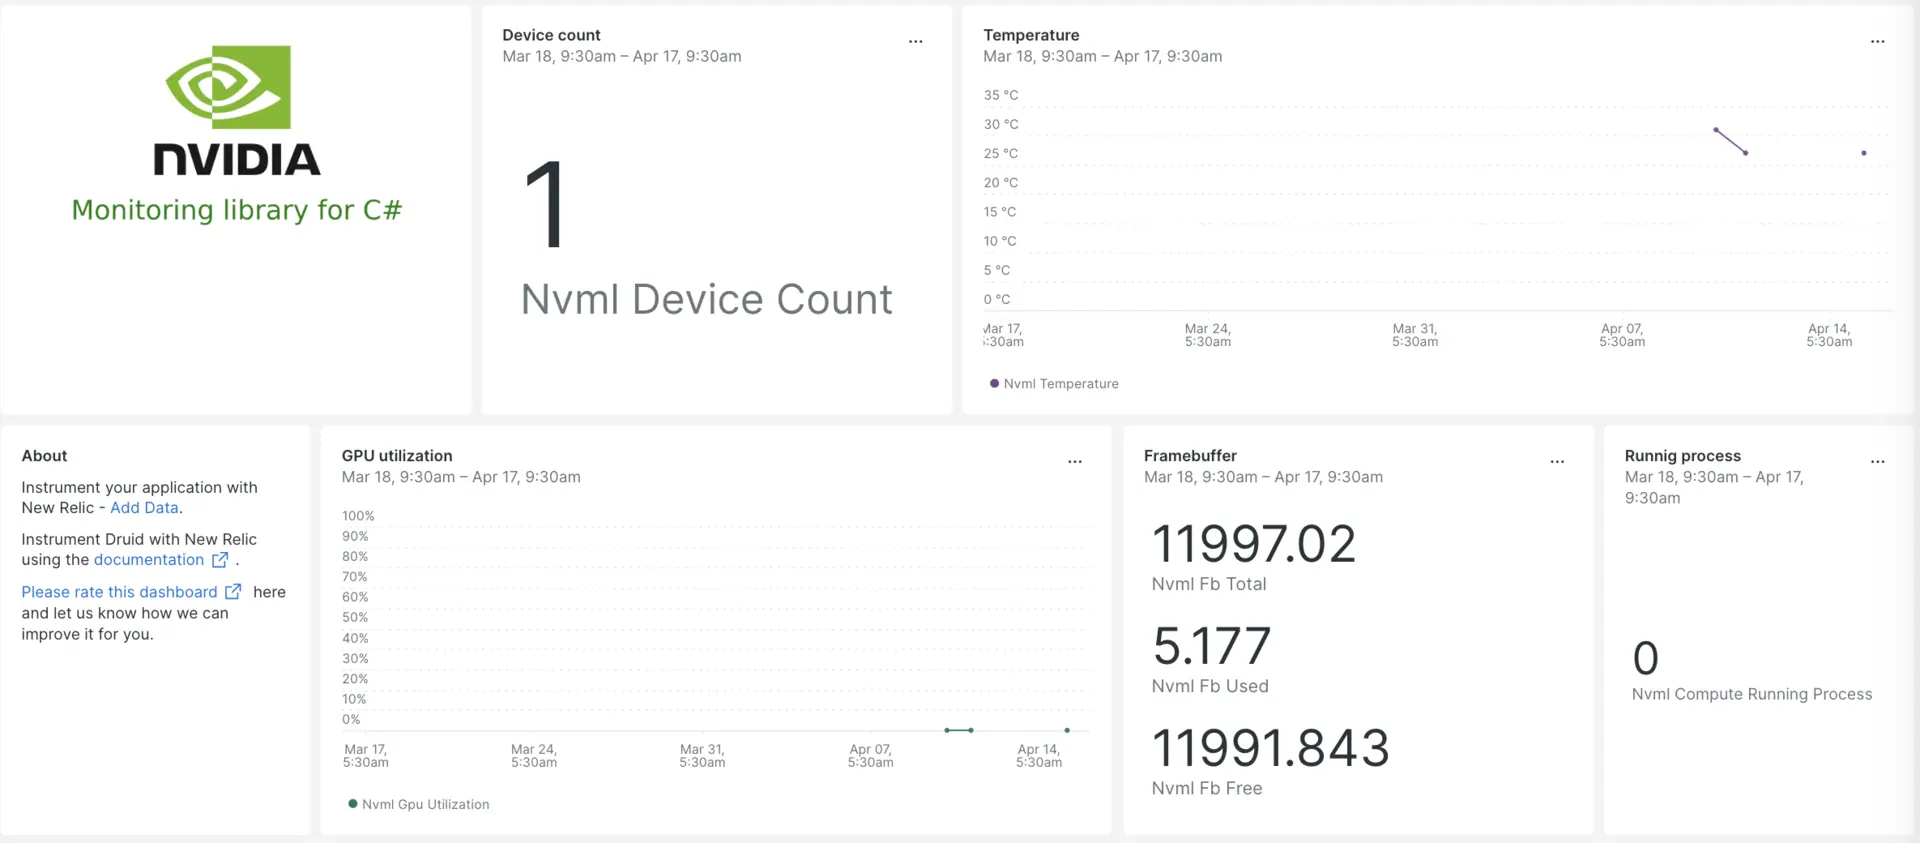
Integrating NVML with New Relic provides valuable insights into the GPU utilization and performance metrics of your applications and systems, facilitating resource optimization, performance bottleneck identification, and the maintenance of overall stability and efficiency in your environment.

After setting up the NVML integration with New Relic, see your data in a dashboard right out of the box.
Set up the NVML integration
Complete the following steps to set up the NVML integration:
Install the infrastructure agent
To use the NVML integration, you need to first install the infrastructure agent on the same host. The infrastructure agent monitors the host itself, while the nvml integration extends your monitoring with data specific to your gpu clusters.
Use NRI-Flex to capture metrics
Flex comes bundled with the New Relic infrastructure agent. You need to configure NRI-Flex for nvml and create a flex configuration file. Follow these steps:
Create a file named
nvml-config.ymlon the path below:- for Linux,
/etc/newrelic-infra/integrations.d - for windows,
C:\Program Files\New Relic\newrelic-infra\integrations.d\
- for Linux,
Use the below snippet to update your configuration file named
nvml-config.ymlintegrations:- name: nri-flex# interval: 30sconfig:name: NVMLexampleapis:- name: nvmlfile: <PATH_TO_METRIC_CSV_FILE>
Restart the infrastructure agent
Use the instructions in our infrastructure agent docs to restart your infrastructure agent. This is a basic command that should work for most people:
$sudo systemctl restart newrelic-infra.serviceView your nvml metrics in New Relic
Once you've completed the setup above, you can view your metrics using our pre-built dashboard template. To access this dashboard:
Go to one.newrelic.com > + Integrations & Agents.
Click on the Dashboards tab.
In the search box, type
nvml.Select it and click Install.
To instrument the nvml quickstart and to see metrics and alerts, you can also follow our NVML quickstart page by clicking on the
Install nowbutton.Here's an example query to check the number of devices in GPU:
SELECT latest(temperature_gpu) FROM nvmlSample TIMESERIES
What's next?
To learn more about building NRQL queries and generating dashboards, check out these docs:
- Introduction to the query builder to create basic and advanced queries.
- Introduction to dashboards to customize your dashboard and carry out different actions.
- Manage your dashboard to adjust your display mode, or to add more content to your dashboard.