Our Apache Traffic Server integration monitors the performance of your Apache Traffic Server HTTP/HTTPS traffic can be forwarded or reverse proxyed in either or both directions, providing both performance and scalability.

After setting up our Apache Traffic Server, you can install a dashboard for your Apache Traffic Server metrics.
Install the infrastructure agent
To get data into New Relic, install our infrastructure agent. Our infrastructure agent collects and ingests data so you can keep track of your app's performance. The version should be 1.10.7 or higher to support NRI-Flex integration.
You can install the infrastructure agent two different ways:
- Our guided install is a CLI tool that inspects your system and installs the infrastructure agent alongside the application monitoring agent that best works for your system. To learn more about how our guided install works, check out our Guided install overview.
- If you'd rather install our infrastructure agent manually, you can follow a tutorial for manual installation for Linux, Windows, or macOS.
Install Apache New Relic Agent
Our Apache integrations collects network metrics like TCP connections, DNS lookup, HTTPS, SSL, and server and worker statuses. To install the integration, follow the steps in our guided install. If you need to install the integration in a different way, see Apache monitoring integration.
Expose your metrics
After successful installation, Apache Traffic Server has to be started successfully, then it should start running on a your_ip with port 8080. You need to configure the metrics exposed stats.
Go to the
plugin.configfile:bash$sudo nano /etc/trafficserver/plugin.configAdd the below line in your
plugin.configfile.stats_over_http.soMake sure your metrics are exposed on the below URL.
Metrics of your Apache Traffic Server:
http://YOUR_IP:8080/_stats
Configure NRI-Flex for Apache Traffic Server
Flex comes bundled with the New Relic infrastructure agent. To create a flex configuration file follow these steps:
Go to the
integrations.ddirectory:bash$cd /etc/newrelic-infra/integrations.dCreate three files named
nri-flex-apache-traffic-server-config.yml,nri-flex-ats-cache-config.yml, andnri-flex-ats-http-config.yml.
The value on the event_type is used to store metrics on the NRDB. Your files should look like this:
nri-flex-apache-traffic-server-config.yml:
integrations: - name: nri-flex interval: 30s config: name: ApcheTrafficServerMetrics apis: - event_type: ATSSampleMetrics url: http://YOUR_IP:8080/_stats remove_keys: - http - cachenri-flex-ats-cache-config.yml:
integrations: - name: nri-flex interval: 30s config: name: ATSCacheMetrics apis: - event_type: ATSCacheSampleMetrics url: http://YOUR_IP:8080/_stats keep_keys: - cachenri-flex-ats-http-config.yml:
integrations: - name: nri-flex interval: 30s config: name: ApcheTrafficServerMetrics apis: - event_type: ATSHttpSampleMetrics url: http://YOUR_IP:8080/_stats keep_keys: - httpForward Apache Traffic Server logs to New Relic
You can use our log forwarding to forward Apache Traffic Server logs to New Relic.
On Linux machines, your log file named logging.yml should be present in this path:
$cd /etc/newrelic-infra/logging.d/After creating the log file, add the following script to the logging.yml file:
logs: - name: manager file: /var/log/trafficserver/manager.log attributes: logtype: ats_manager_logs - name: diags file: /var/log/trafficserver/diags.log attributes: logtype: ats_diags_logsRestart the New Relic infrastructure agent
Before you can start reading your data, use the instructions in our infrastructure agent docs to restart your infrastructure agent.
$sudo systemctl restart newrelic-infra.serviceIn a couple of minutes, your Apache Traffic Server will send metrics to one.newrelic.com.
Find your data
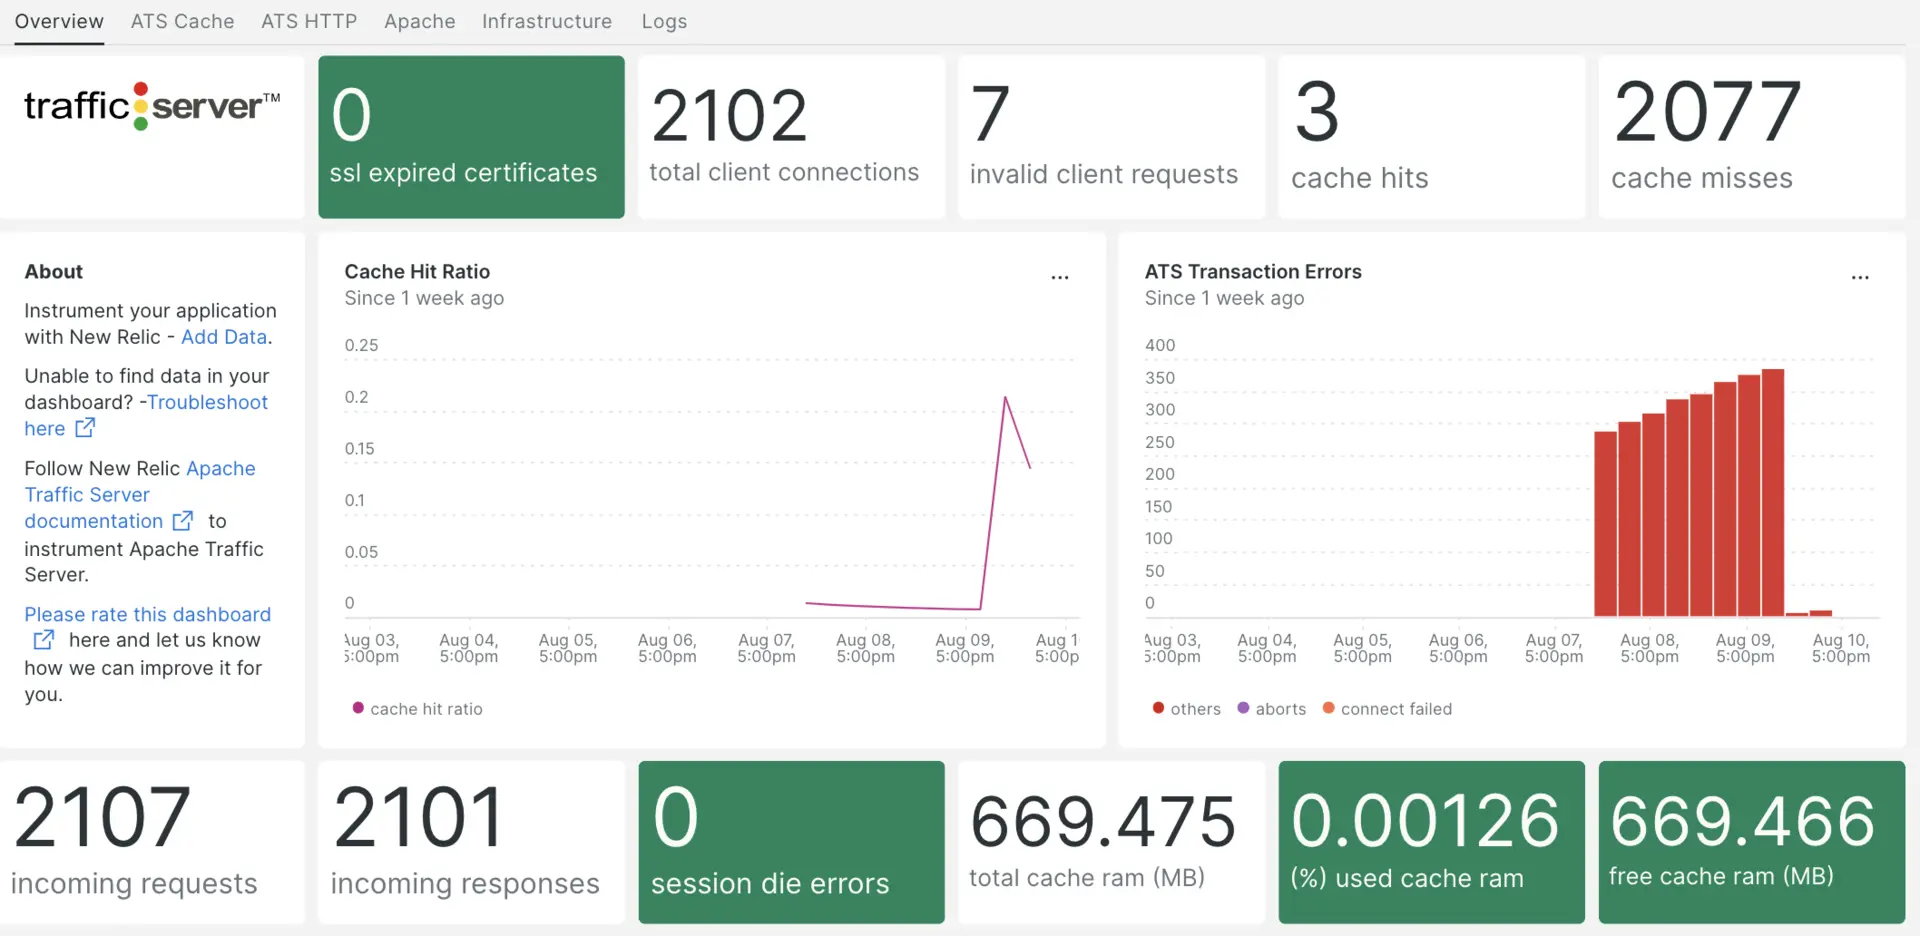
You can choose our pre-built dashboard template named Apache Traffic Server to monitor your Apache Traffic Server server metrics. Follow these steps to use our pre-built dashboard template:
- From one.newrelic.com, go to the + Integrations & Agents page.
- Click on Dashboards.
- In the search bar, type
Apache Traffic Server. - The Apache Traffic Server dashboard should appear. Click on it to install it.
Your Apache Traffic Server dashboard is considered a custom dashboard and can be found in the Dashboards UI. For docs on using and editing dashboards, see our dashboard docs.
Here is a NRQL query to check the cache total misses from the Apache Traffic Server:
SELECT latest(global.proxy.process.cache_total_misses) AS 'cache misses' FROM ATSCacheSampleMetricsWhat's next?
To learn more about building NRQL queries and generating dashboards, check out these docs:
- Introduction to the query builder to create basic and advanced queries.
- Introduction to dashboards to customize your dashboard and carry out different actions.
- Manage your dashboard to adjust your dashboards display mode, or to add more content to your dashboard.