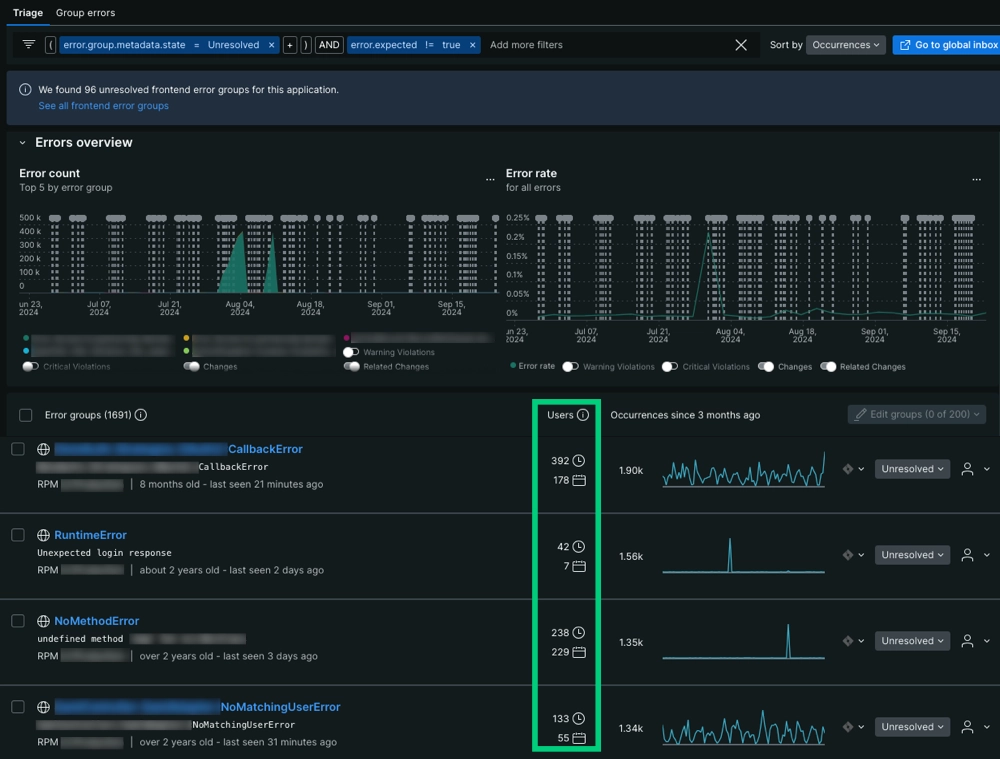
New Relic agents automatically capture data about user impact. When you organize by error group, you can see how many users are affected by errors. This helps you prioritize where to focus your debugging efforts by showing you the errors with the highest numbers of users affected.

Go to one.newrelic.com > APM & Services > Errors (errors inbox) > Triage: You can find users impacted in the second column of the Error groups table, located beneath the Error count and Error rate time series.
Custom attributes to track users impacted
In some cases, an error event may not have attributes that identify the end user affected by that error event. You can manually add custom attributes so our agents capture user-identifying metadata at the time of ingest.
For cases where you need to add a custom attribute, we recommend reviewing OpenTelemetry's attribute conventions because there are multiple common conventions for naming end user attributes.
For example, OpenTelemetry standards uses the following attributes in order of priority:
userIduser
You can review how New Relic processes custom attributes by reading our doc about collecting custom events.
Query for users impacted
The number of users impacted on an error group is recorded as a Metric data type with the name newrelic.error.group.userImpact. You can use this metric with the following NRQL string:
SELECT uniqueCount(newrelic.error.group.userImpact) FROM Metric WHERE metricName='newrelic.error.group.userImpact'The metric captures the approximate number of unique users in the time period selected. Additional attributes provided by the userImpact metric which can be used in a FACET clause are error.group.guid, entity.guid.
Alert on users impacted
By creating an NRQL alert condition, developers can trigger when the amount of users impacted by errors exceeds a threshold.
Creating this alert requires determining the NRQL query which measures the amount of users impacted in a way which best captures your use case.
As an example, the following NRQL query measures the amount of unique users which have been impacted by an error group coming from a specific entity:
SELECT uniqueCount(newrelic.error.group.userImpact) FROM Metric WHERE metricName='newrelic.error.group.userImpact' AND entity.guid='RXxCUk9XU9182nNEFQUExJQ0FLsU9OfDgzNzgwNw' FACET error.group.guid TIMESERIESRead more about using the uniqueCount() function, how to find the entity GUID for your entities.
Similarly, the following NRQL query measures the total number of users impacted by errors from all entities under the account in the last hour:
SELECT count(newrelic.error.group.userImpact) FROM Metric WHERE metricName='newrelic.error.group.userImpact' SINCE 1 hour ago TIMESERIESOnce you have decided on a NRQL query, it can be used to create a NRQL alert condition.
To improve the signal to noise ratio of your triggered alerts see alert creation tips, how alert thresholds are evaluated, and alert condition examples.
Set users impacted with setUser method
You can use an agent method to identify an end user. See implementation details for each agent below:
Agent | Method to identify an end user |
|---|---|
Browser | |
Go | |
Java | |
Mobile | |
.NET | |
Node.js | |
PHP | |
Python | |
Ruby |