Session traces provides a detailed timeline of the load and interaction events during a webpage's full life cycle up to ten minutes. Select the session URL or session trace ID, you can use the detailed waterfall visualization and heat map overview to examine metrics and identify problems related to:
- Page load timing
- Individual asset loads
- User interactions
- AJAX requests
- Callbacks
- Errors and other events during the session

Go to one.newrelic.com > Browser > (select an app) > Session traces: Here is an example of some of the wealth of information you can explore in a session trace.
Use cases
Session traces help you solve the following problems:
Problem | Use session traces to... |
|---|---|
Backend problems | See how long it takes from when the request begins to when backend activity finishes and the DOM loading process begins. |
Page load timing issues | Explore data that helps you answer questions such as:
|
Poor core web vitals | Look at the timing segments for interaction to next paint and largest contentful paint to identify performance issues affecting your core web vitals. |
JavaScript events | Examine the sequence of JavaScript and browser events to understand:
|
Errors | Sort or filter the errors to see what patterns emerge. For example, you can check whether errors increase based on:
|
By connecting performance to user experience and interactions to performance, the ability to see all events in the user's session can help you pinpoint problem areas and identify solutions. You can also create a permalink to share this information with others.
Get started
Prerequisites
Go to one.newrelic.com > All Capabilities > Browser.
Select your browser app.
In the left-hand menu, click Application settings.
On the Application settings page, make sure Pro or Pro + SPA browser agent is selected. Session trace is not available for the Lite browser agent.
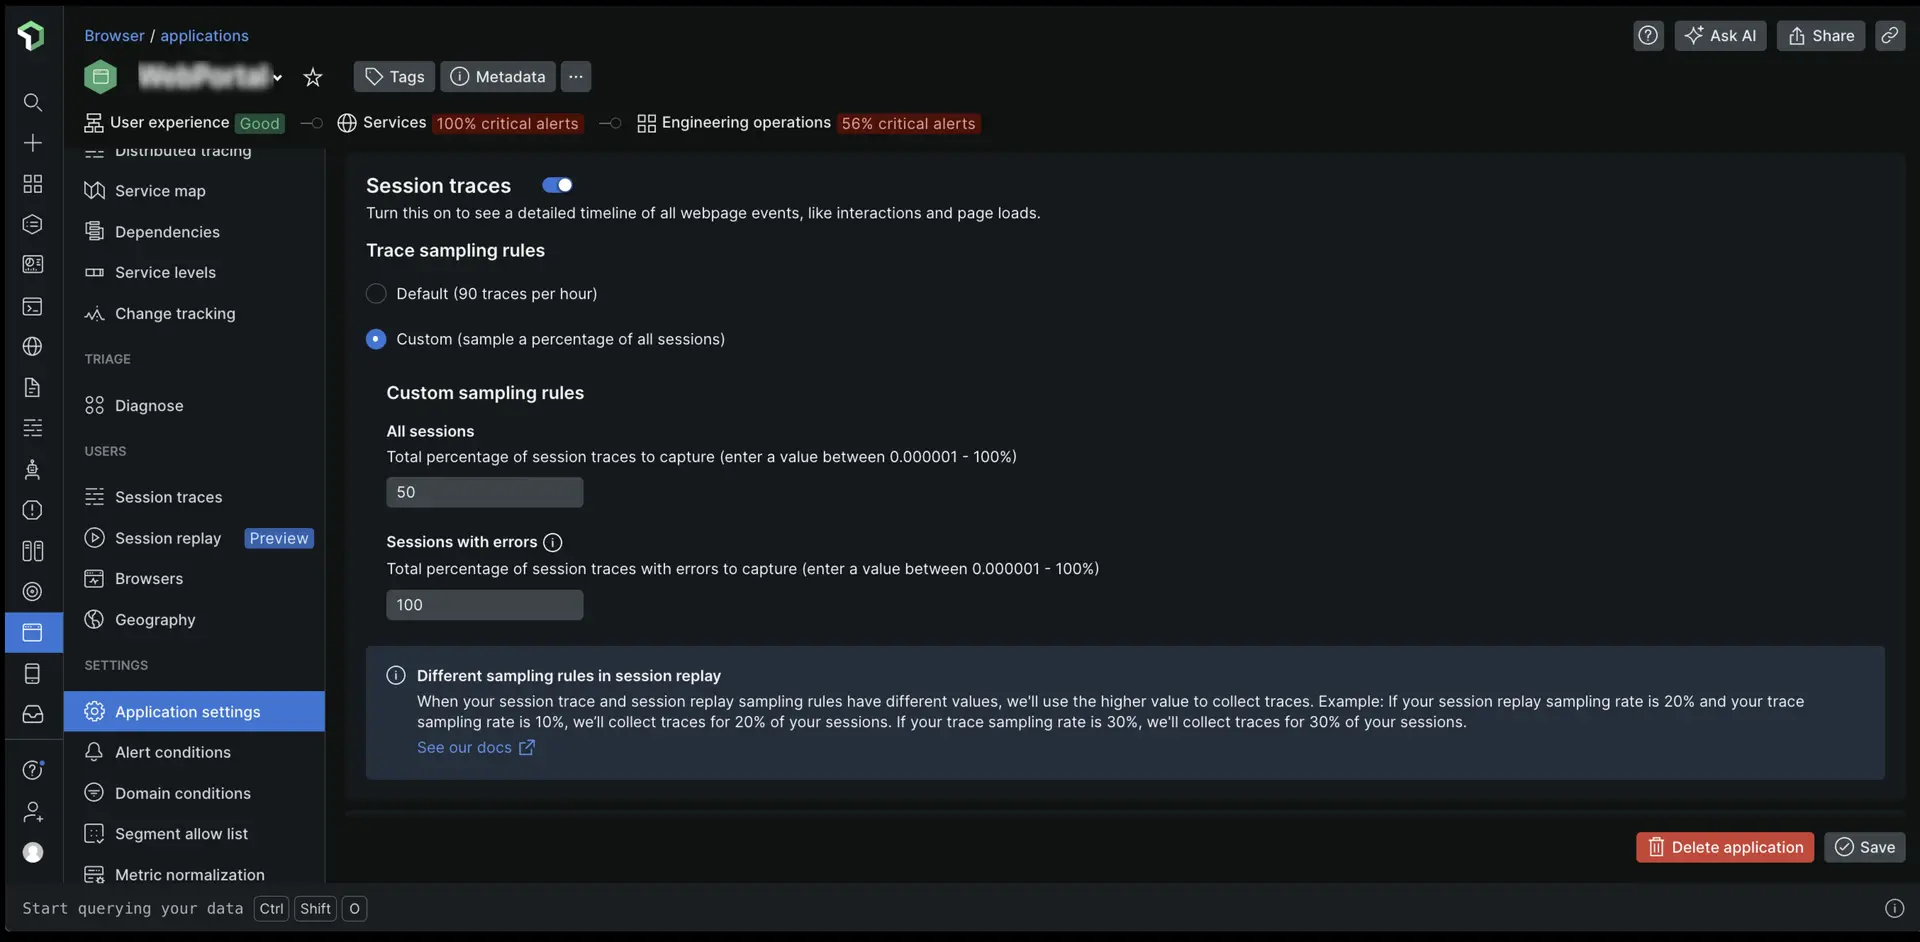
Verify Session traces are toggled ON. They are enabled by default.
Traces will only be captured from browsers that support the Resource Timing API.
If you're using multiple names for an app, session traces will only report to the most specific application.
Configure sampling rates

Choose your sampling mode:
Default collects 90 traces per hour regardless of your application's traffic. Choose this mode if you only need a small sample of session traces. Note that there may not always be traces available on sessions you're troubleshooting.
Custom allows you to collect traces for 0.000001-100% of all sessions and 0.000001-100% of errored sessions. Choose this mode if you want more session traces available to troubleshoot page load timings or JavaScript errors.
For example, if you set the session sampling rate to 50% and the error sampling rate to 100%, it means that:
Half of all user sessions will collect a trace.
All errored sessions will collect a trace, even if they're not part of the 50% sample. The agent buffers a sliding window of data for up to 30 seconds on the client side, and if errors occur, the buffered data will be harvested and the remainder of the session will be traced. If an error does not occur, the trace is never harvested.
Importante
When your session trace and session replay sampling rules have different values, we'll use the higher value to collect traces.
For example, if your session replay sampling rate is 20% and your trace sampling rate is 10%, we’ll collect traces for 20% of your sessions. If your trace sampling rate is 30%, we'll collect traces for 30% of your sessions.
Select a session trace

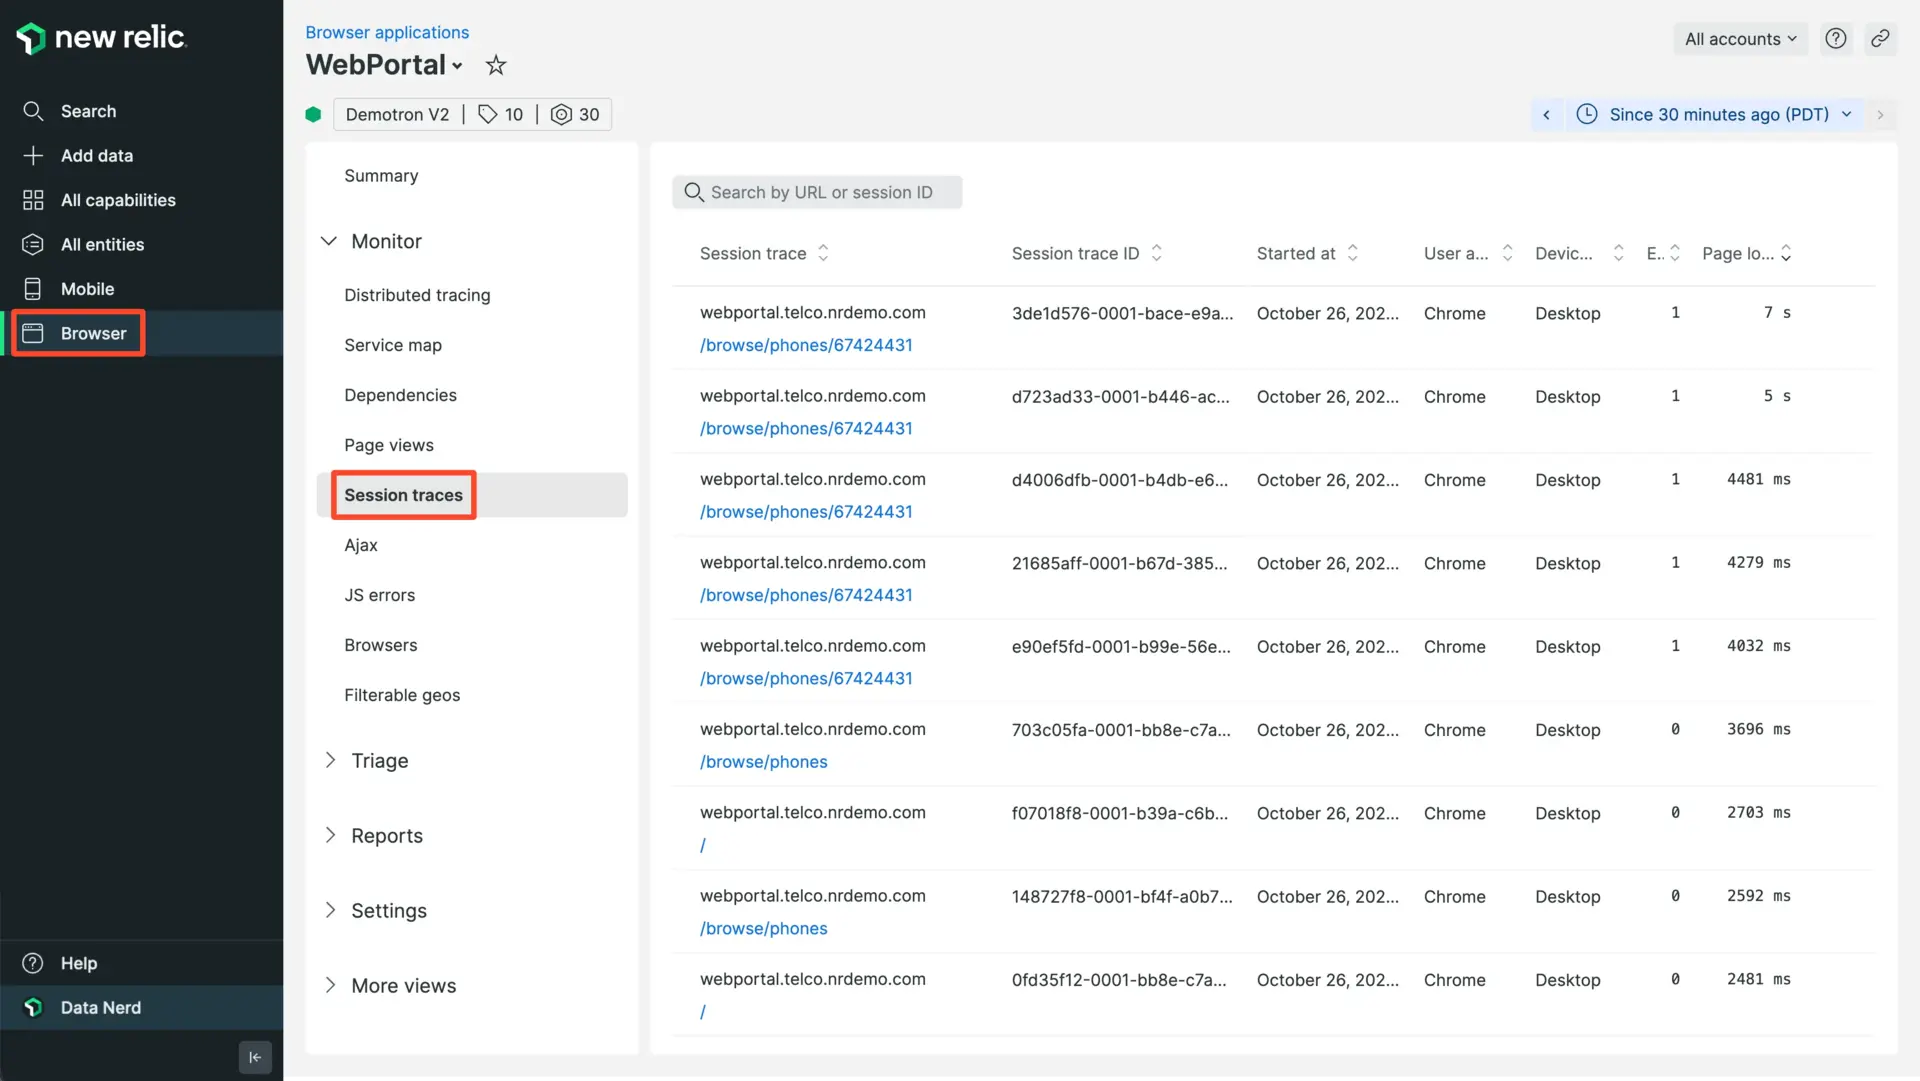
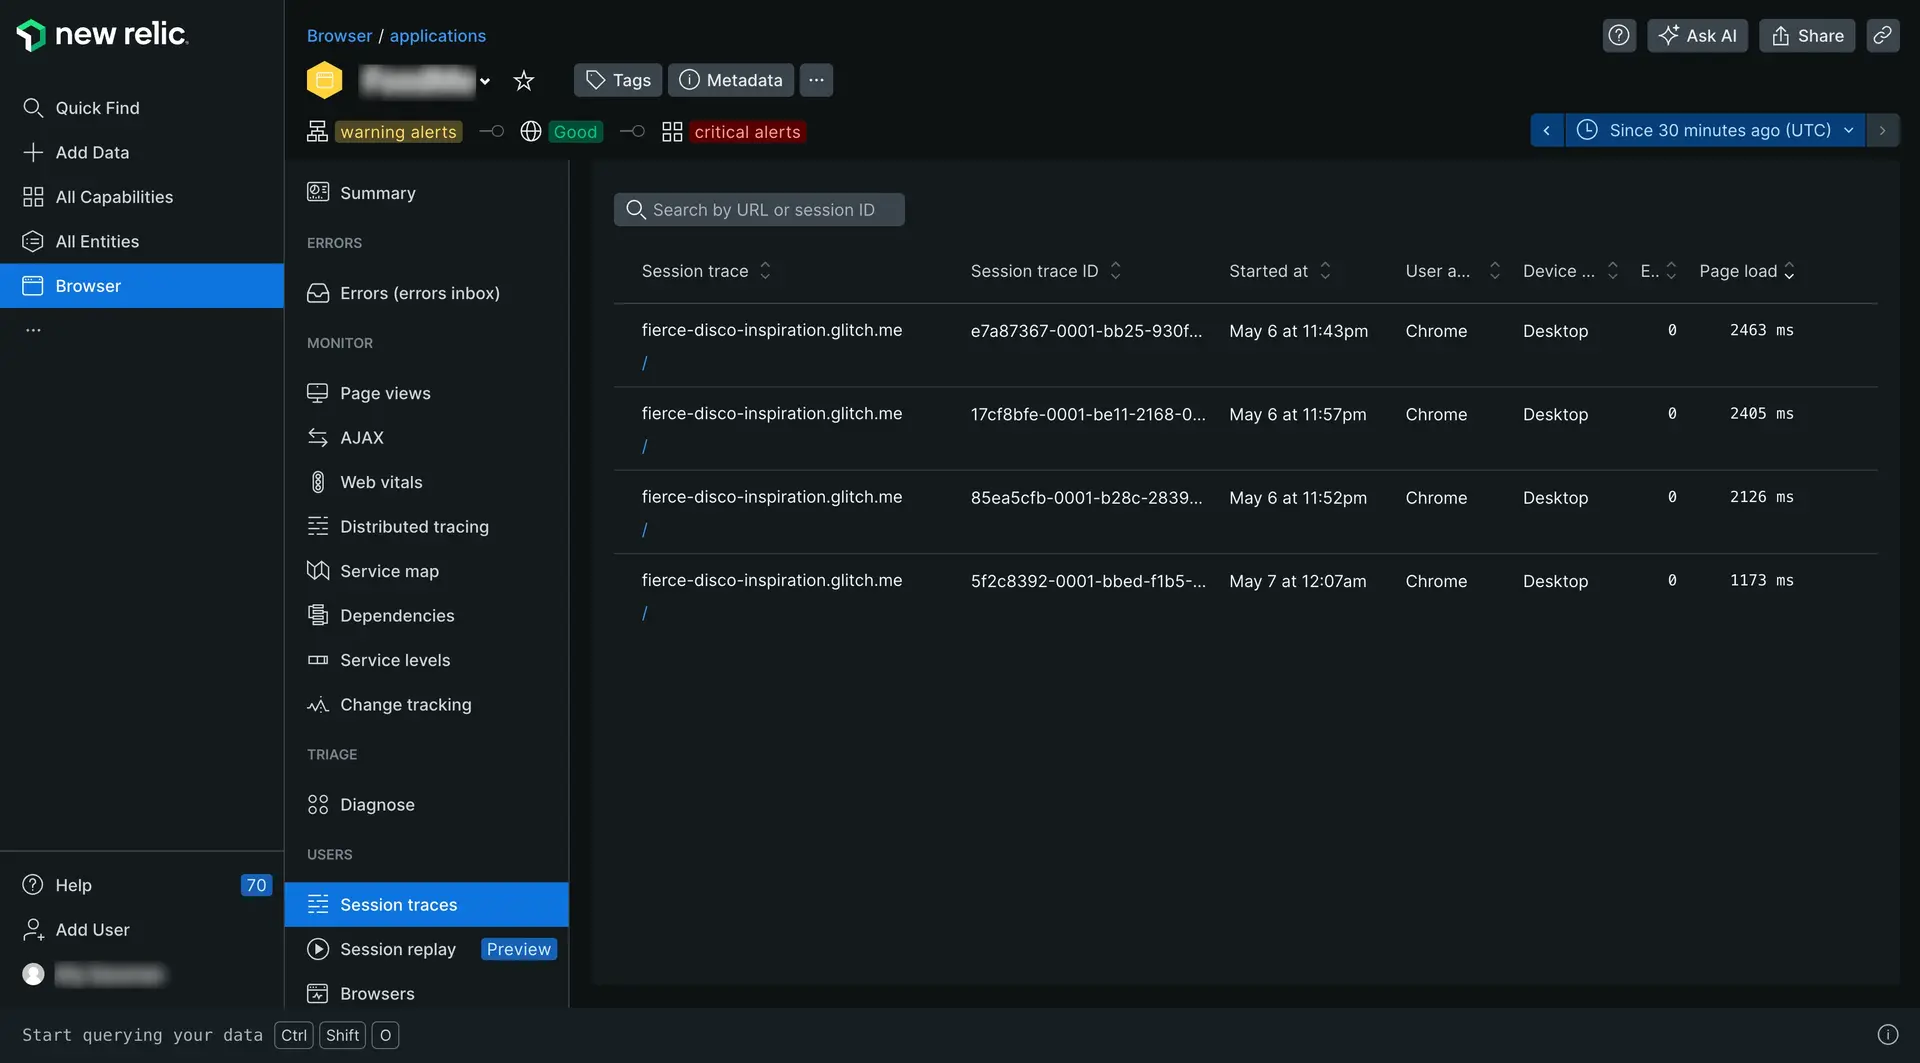
one.newrelic.com > All capabilities > Browser > (select an app) > Session traces: Search by URL or session trace ID, or sort any column, then click the link to use the interactive session trace details.
To select a specific session trace:
Go to one.newrelic.com > All capabilities > Browser > (select a browser app) > Session traces.
To limit the index to a specific URL or session trace ID, use the search window.
To look for other patterns, change the sort order on any column.
Click the session trace link, then use the details page to drill down into detailed information.
For deeper analysis, you can also query attributes such as
session,sessionTraceId,largestContentfulPaint, etc. For more information, see our documentation about browser monitoring event data as well as our data dictionary.
Session segment definitions
For apps that have been deployed using the copy/paste method in New Relic, browser monitoring includes web app and queue time in Network time as part of the page load timing process. This is because browser monitoring relies on the server-side agent to pass the application values to the browser agent through auto-injection.
You can view detailed information about how this backend time breaks down from the browser's point of view. The session traces report on all the network related events available, so you can see on a case-by-case basis how the browser spends time on DNS lookups and other network events.
Measurements for each segment indicate how long into a session that the segment ended. For example, if Page load is 6.9s, this means the page load event completed 6.9 seconds after the request began.
The following table describes each segment of the session trace, with a link to the data dictionary for more details about these attributes.
Session segment | Description |
|---|---|
The time from when the request began to when backend activity finished and DOM loading began. | |
The time from when the request began to when DOM processing finished. | |
The time from when the request began to when the page load event fired. | |
The time from when the request began to when AJAX activity ended. | |
The time from when the request began to when the first user activity was recorded, such as a mouse click or a scroll. | |
Core web vitals: Measures how quickly a web page visually responds to user actions like clicks or taps. | |
Core Web Vitals: The render time of the largest content element that is visible in the viewport. | |
The total duration of the session. |
Slow JavaScript execution and repainting
Session traces help you identify callbacks in your JavaScript code that execute slowly and block the execution of subsequent calls on the browser's main thread. These calls should execute quickly in order to allow the browser to quickly repaint the page in response to user actions.
Session traces highlight any callbacks longer than 33ms. If called in rapid succession (such as inside a requestAnimationFrame loop), callbacks longer than 33ms reduce the frame rate below 30 frames per second. This speed seems sluggish to users.
Disable session tracing
To disable session tracing in the UI:
- Go to one.newrelic.com > All Capabilities > Browser.
- Select your browser app.
- In the left-hand menu, click Application settings.
- Toggle Session traces to OFF.