Building on AWS means navigating complicated architectures that make managing application uptime and performance difficult. And while AWS tooling can be helpful, you still need to gather the right telemetry for each resource, establish tagging for correlation, create the right dashboards, and set thresholds of acceptable performance. Even with these measures in place, teams often find it challenging to correlate data across applications and infrastructure to determine the cause of a performance issue.
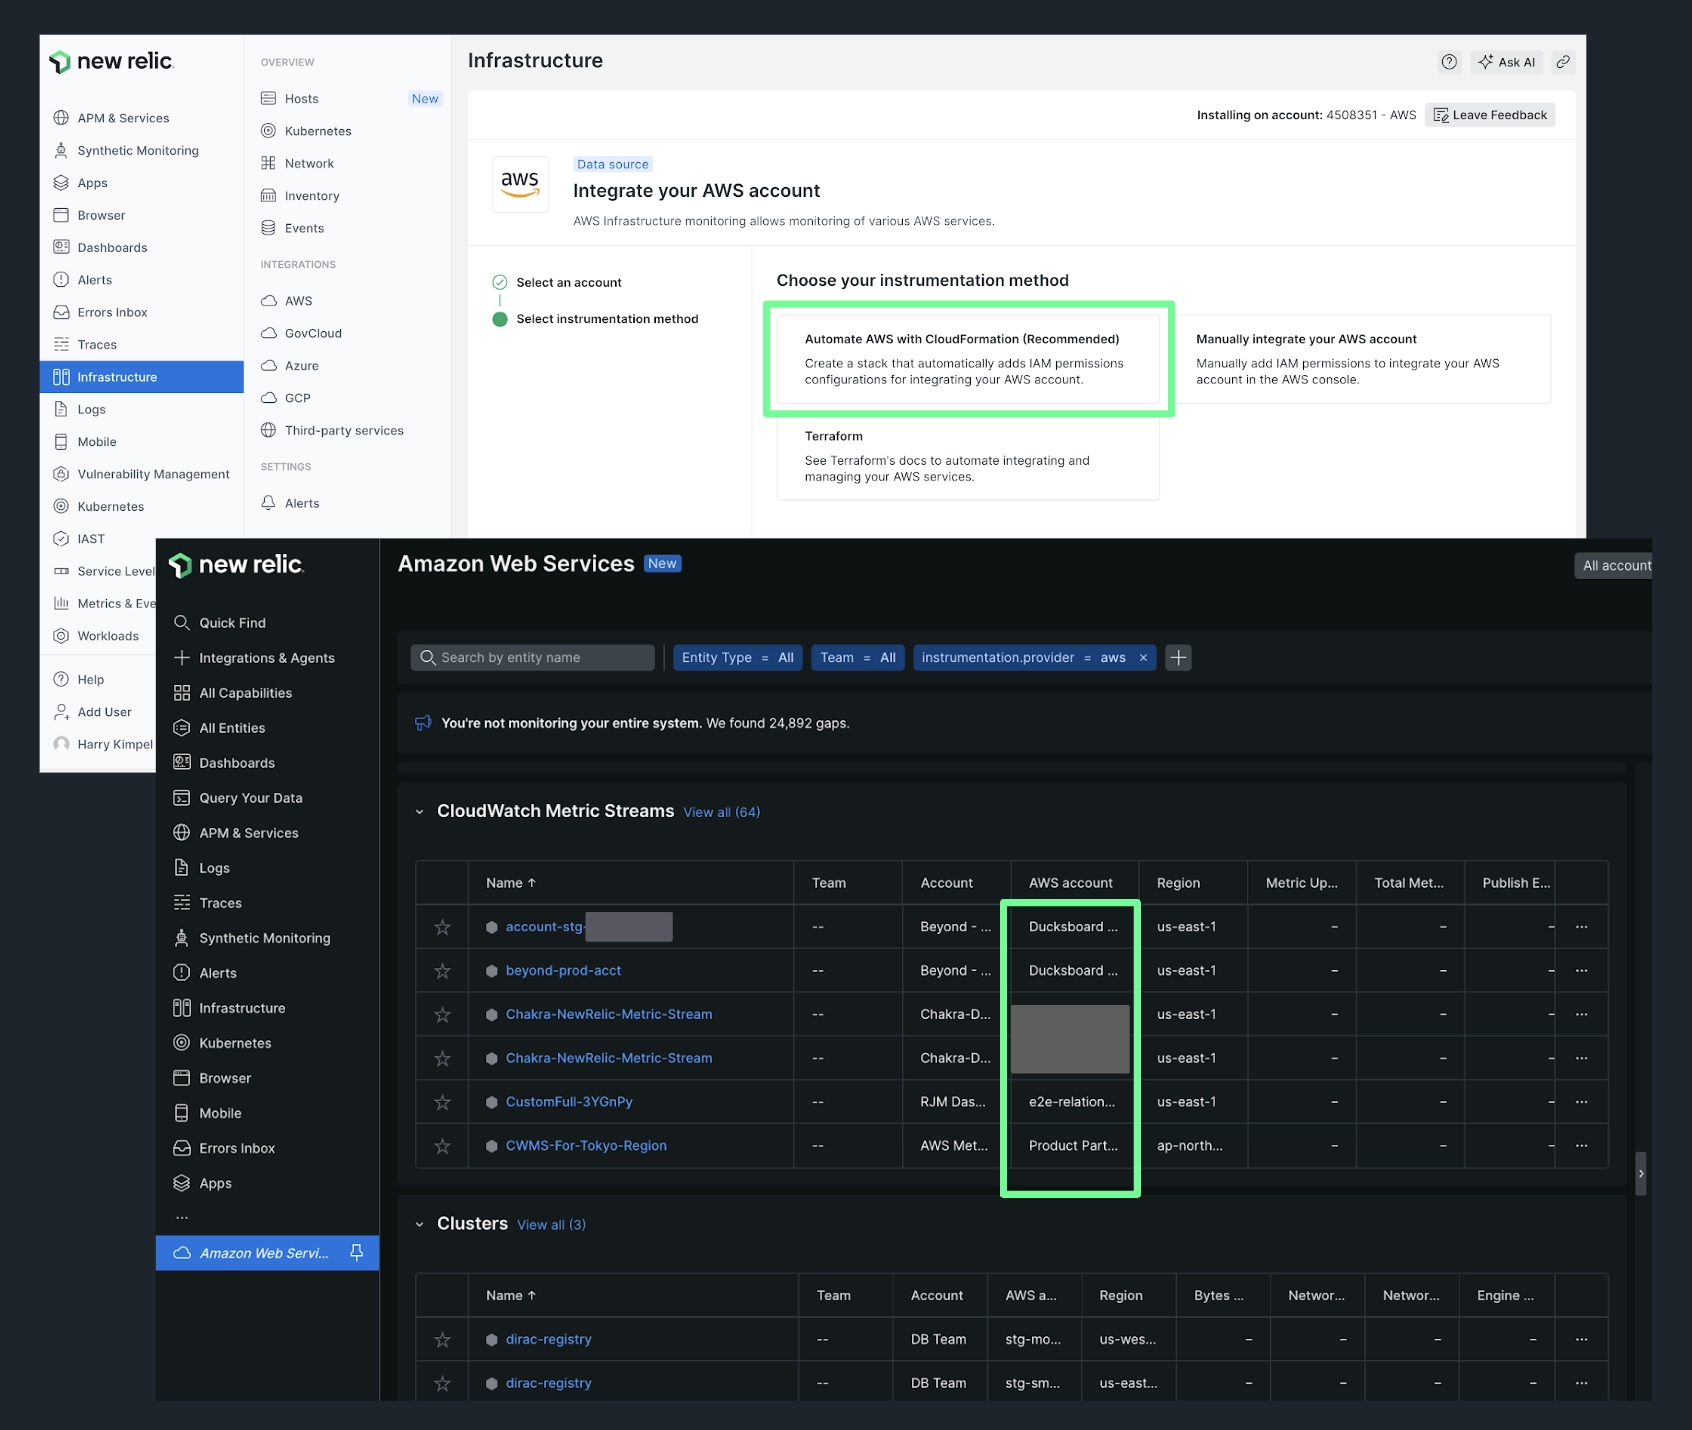
New Relic’s intelligent observability platform gives you one place to correlate the performance of your AWS infrastructure and all your apps, so you can rapidly solve performance issues and manage your cloud resources and costs. And now, we’ve made it even easier to get started faster, with one-step onboarding, automatic dependency mapping (no manual tagging), and pre-built dashboards that provide contextual insight across your AWS environment.
New capabilities:
-
One-step onboarding: Get started faster with easy instrumentation and pre-configured dashboards for top AWS services using CloudWatch Metric Streams and polling.
-
Agentless EC2 monitoring: Correlate your EC2 instances with APM without the need to install or configure infrastructure agents.
-
One UI to monitor AWS: View AWS entities, cloudwatch metric streams, and polling on a single page, removing blindspots across your AWS environment.
-
Multi-account onboarding: Improve operational efficiency and costs by onboarding all of your AWS accounts in a single workflow.
-
Automatic relationship discovery and mapping: Understand the dependencies across applications and AWS infrastructure.
Watch the Data Byte to learn more
