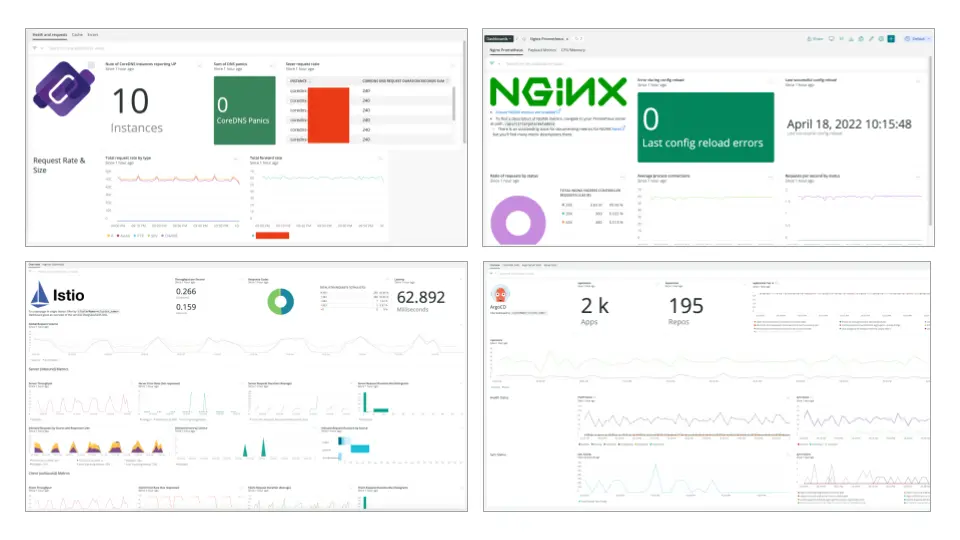
New Relic Instant Observability helps you instrument, monitor, and analyze your stack in minutes with hundreds of pre-built quickstarts. If your tech stack includes Kubernetes or Prometheus you can benefit from an easy instrumentation experience, curated dashboards, and pre-configured alerts for Istio, ArgoCD, CoreDNS, NGINX, Redis, and the Prometheus Node Exporter.

The latest quickstarts to help you get started with Kubernetes and Prometheus observability include:
- Istio Service: get a dashboard view of services running in your Kubernetes cluster using an Istio Service Mesh. Learn how to monitor service mesh performance from our blog.
- ArgoCD: see the performance and availability of the ArgoCD platform within Kubernetes.
- CoreDNS: visualize CoreDNS performance and alert on potential errors. CoreDNS is a critical Kubernetes cluster component and can be difficult to troubleshoot in an error scenario, learn how to monitor CoreDNS from our blog.
- NGINX Ingress Controller: monitor performance and alert on potential configuration errors.
- Redis: discover all critical performance and health metrics relevant to your Redis system monitored by Prometheus.
- Prometheus Node Exporter: dashboard view for host metrics gathered through Node Exporter.
Learn more about integrating Kubernetes and Prometheus with New Relic.