Use the Resources page to understand the load time impact of each resource on your website. Use the resources load time, time spent by third parties, and irregular response codes graphs for a high-level overview, and use the resources list to identify high-impact resources such as large CSS files or images.
You can also investigate a specific resource with detailed resource metrics, which aggregate performance information for a single resource. Go even deeper and view one load of that resource, using the exact request and response headers to pinpoint a performance issue.
View the Resources page
To access your monitor's Resources page, go to one.newrelic.com > Synthetic monitoring > (select a monitor) > Resources.

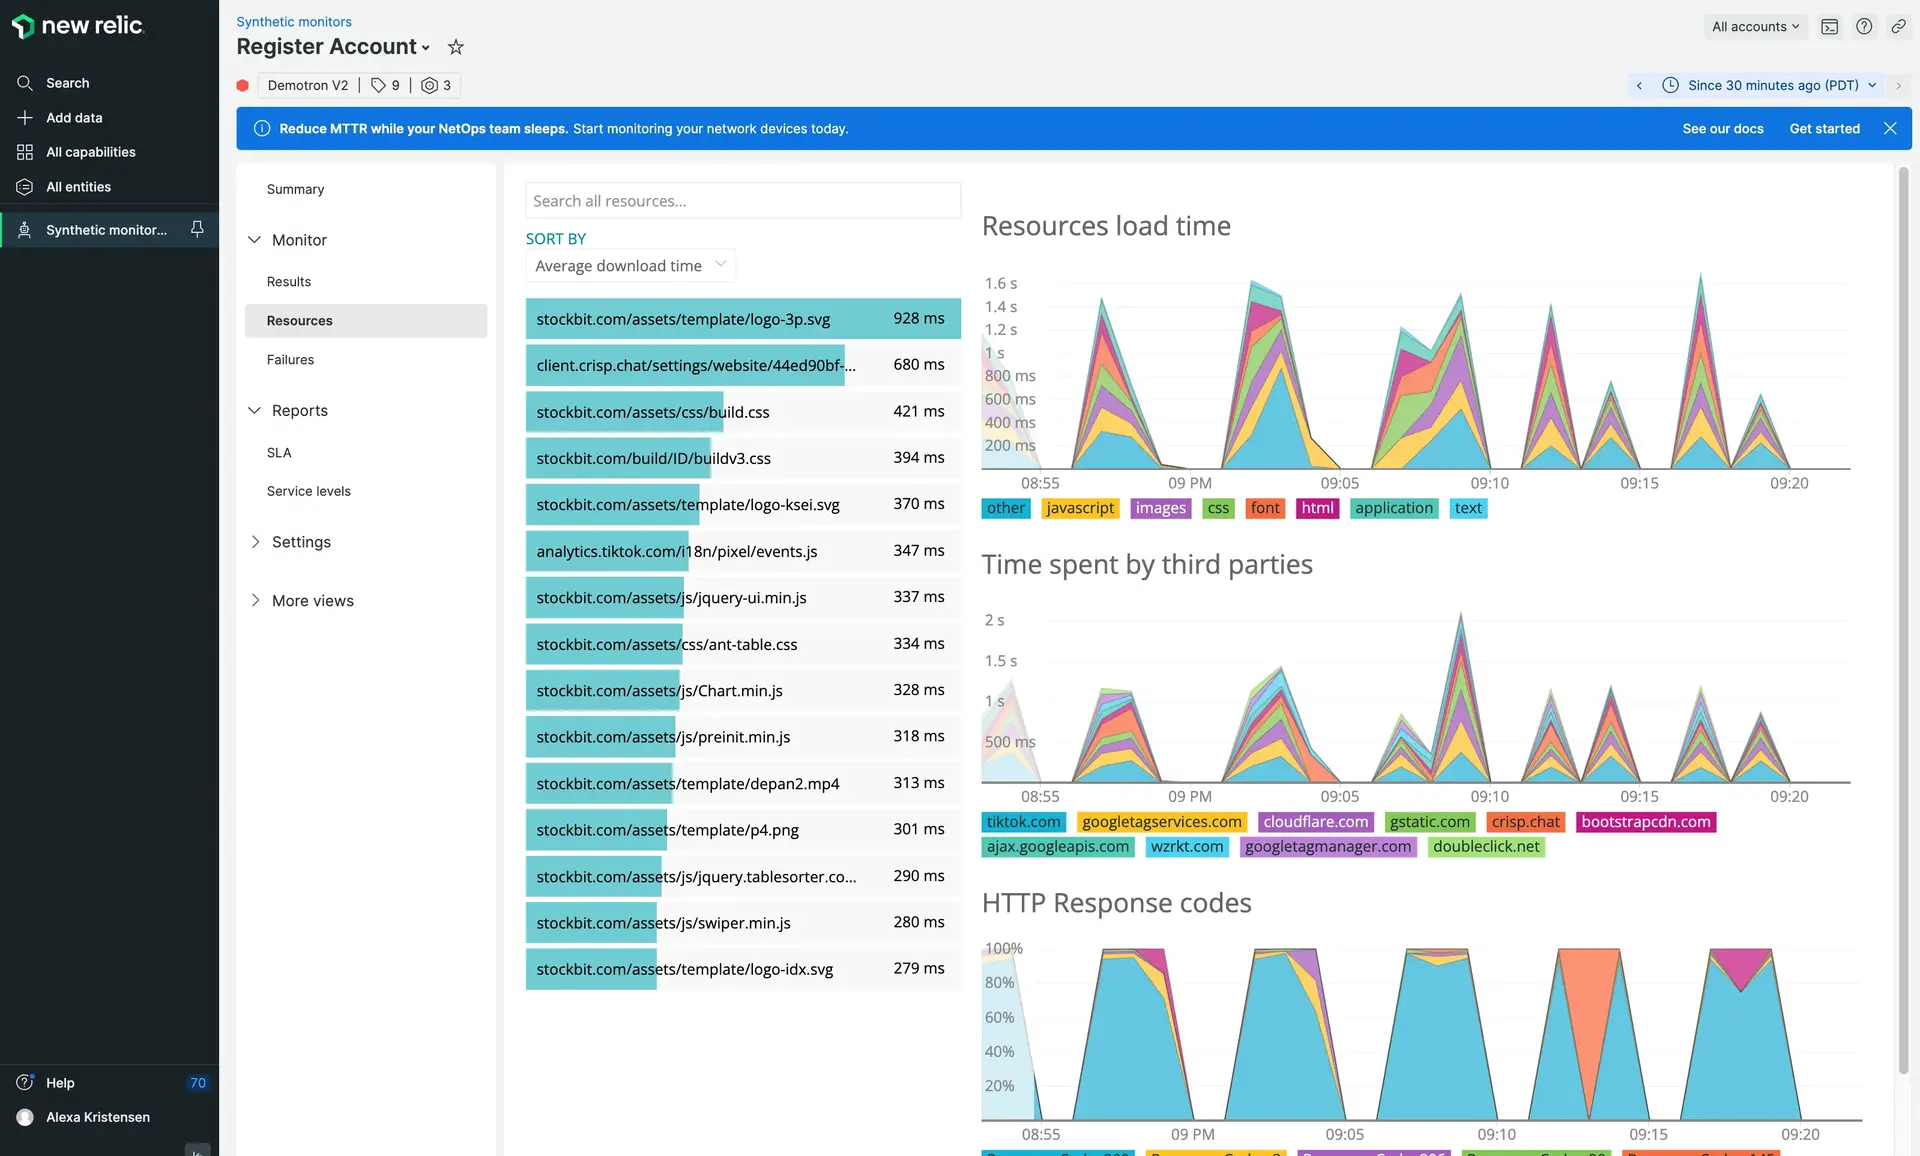
one.newrelic.com > Synthetic monitoring > (select a monitor) > Resources: Use the Resources page to analyze the performance of each resource on your website and access detailed metrics with individual resource loads.
Understand resource metrics
Use the Resources page to understand the performance impact of each resource on your website:
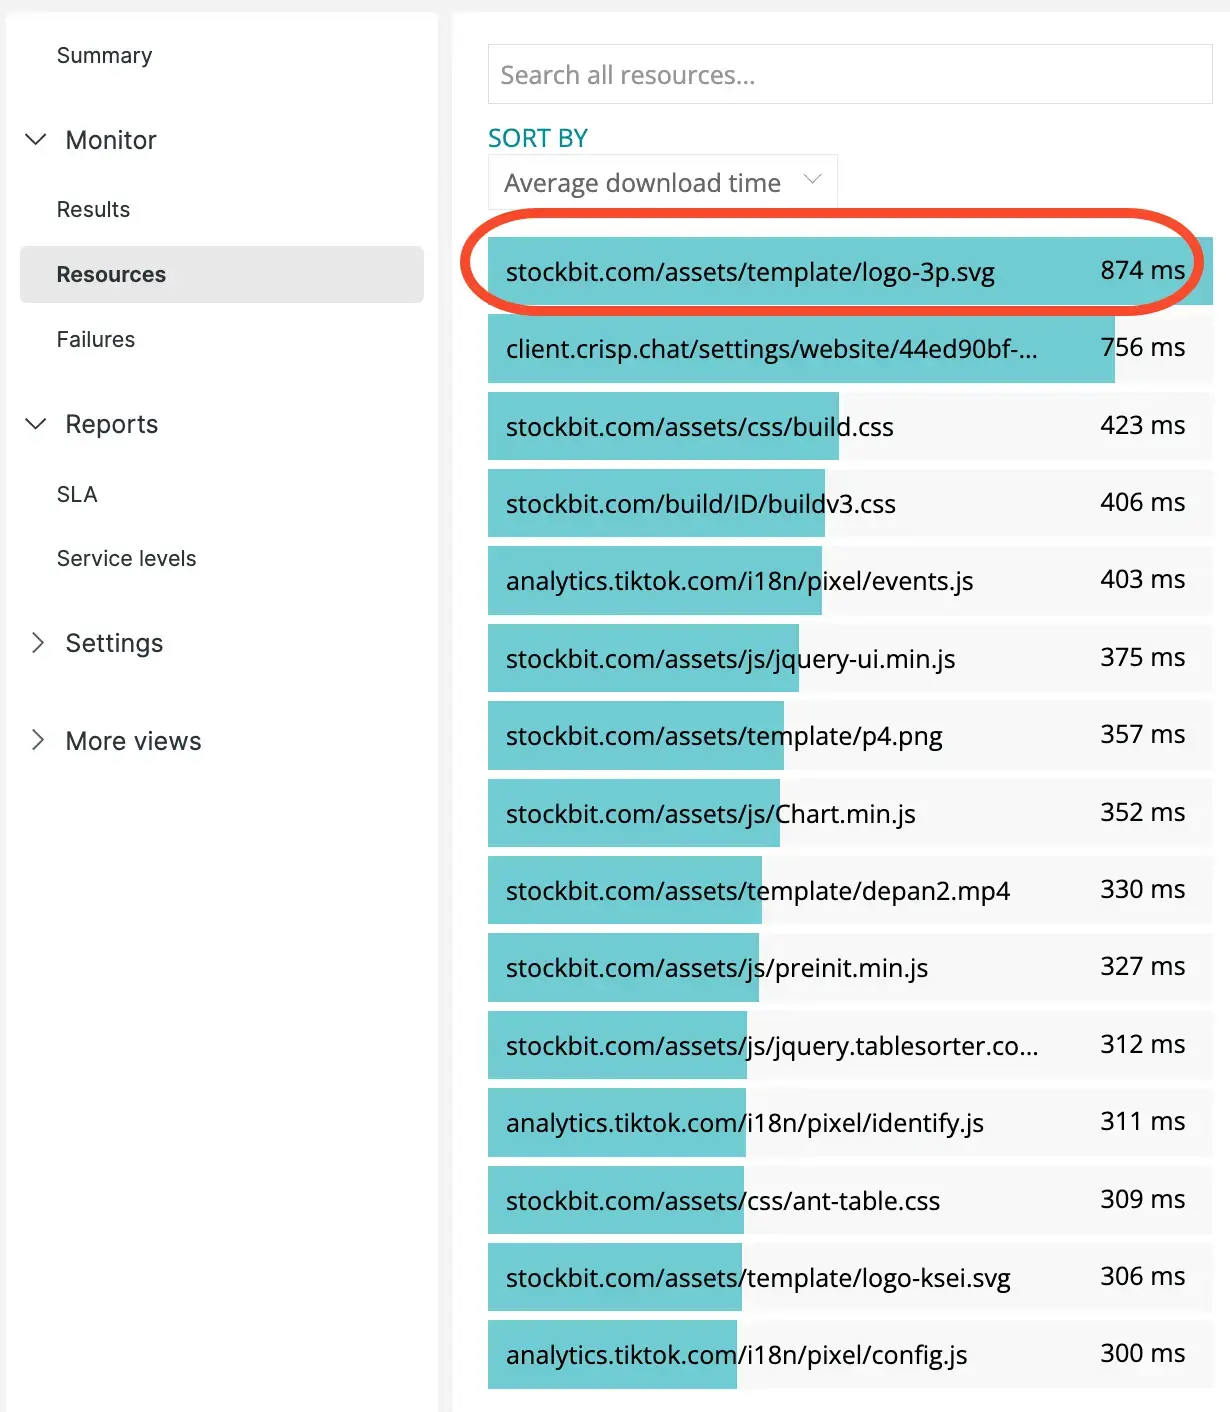
- Resources list: Lists the resources on your monitored website by average download time. Use this list to optimize your website's performance by reducing download times. You can also view the load time for any particular resource by searching for it in the Search all resources field. Select a resource to view individual resource metrics.
- Load time: Graphs the average load time for all resources, broken down by resource type (such as
jpeg,json, orjavascript). Use this graph to understand how the load time of your website changes over time. - Time spent by third parties: Graphs the average load time of all third-party resources, such as web fonts, an embedded Twitter timeline, or an externally hosted image. Use this graph to see if third-party websites are affecting your website's performance.
- Irregular response codes: Graphs the number of negative HTTP response codes (also called HTTP status codes) received by the monitor. This graph includes all responses in the 300 (redirection), 400 (client error), and 500 (server error) ranges. It does not count responses in the 100 or 200 ranges. Synthetics also collects a number of custom response codes.
By analyzing these metrics, you can track down troublesome resources and improve their performance. For example, an unoptimized logo image might cause slowdowns for every visitor of your site, while a tracker that is served only from a US-based server could result in slow performance for non-US visitors.
View detailed resource metrics
You can also view detailed metrics for each resource on your site. To view detailed metrics, locate a specific resource, or simply select an interesting resource from the Resources page. After selecting a resource, you can view overview metrics for that resource, or view an individual resource load:
- Max duration, Min duration, Avg duration: Load time metrics for this resource over the selected time frame.
- For 50% of requests: The maximum download time for the fastest 50% of requests. This means that 50% of requests for this resource were completed in the specified time or faster.
- For 95% of requests: The maximum download time for the fastest 95% of requests. This means that 95% of requests for this resource were completed in the specified time or faster.
- Average load time: Graphs the average load time for this resource over the selected time frame. Use this graph to verify that optimizations to your website (such as decreasing the size of an image or minifying your CSS) are working.
You can also hide and unhide chart elements, filter by location, and sort the resource results list by Download time or DNS lookup. Mouse over the resource name to view the full path (useful with very long dynamically generated resource names).
View individual resource loads
After viewing detailed metrics for a particular resource, you can select an individual resource load for an in-depth understanding of one poor performance alert event. You can then view a breakdown of the total connection time to understand where the issue occurred, and examine request and response headers.

one.newrelic.com > Synthetic monitoring > (select a monitor) > Resources > (select a resource) > (select a resource load): Select an individual resource load to see a detailed breakdown of connection time, request headers, and response headers. Network timing structure taken from the HTTP Archive 1.2 specification.
Use page functions
The Resources page supports the following features:
If you want to... | Do this... |
|---|---|
Sort the results list | From the Sort By dropdown, select a sort option:
|
Hide and unhide chart elements | Select chart elements to hide and unhide them.  |
Locate a specific resource | Enter part of your resource name in the Search all resources field (for example, search-icon.webp or latest.json). Select the resource to view detailed metrics for that resource. |
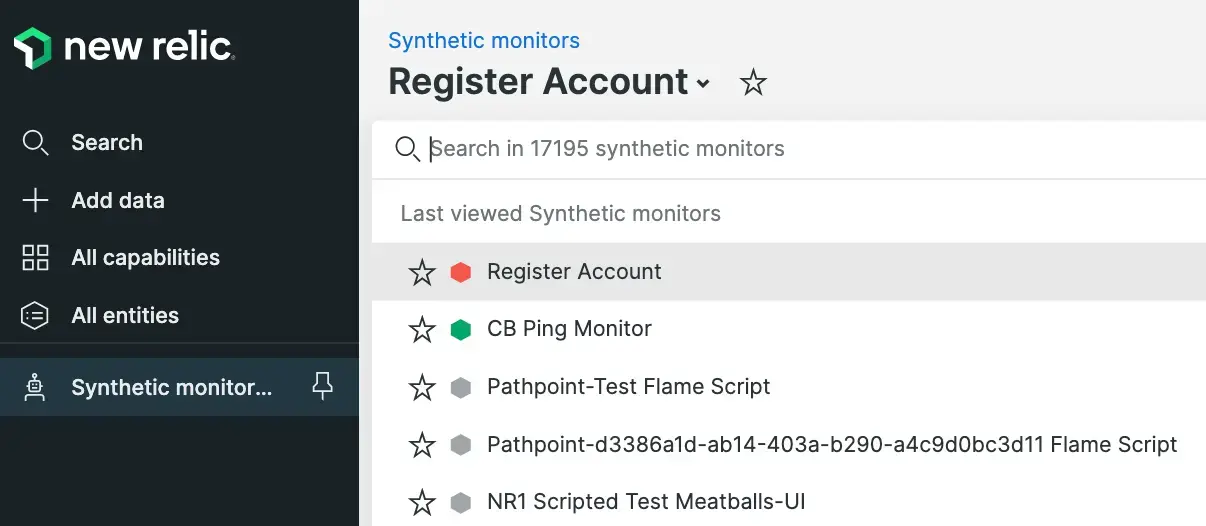
Quickly access another monitor | |
Change the time frame | Use the time picker to adjust the number of results returned. |
