Kafka monitoring provides real-time visibility into your Apache Kafka clusters to ensure reliable data streaming and prevent costly downtime in distributed systems. Using a collector-based approach, you get comprehensive monitoring through a flexible, vendor-neutral solution that works across self-hosted environments and Kubernetes with Strimzi.
Collector options
New Relic supports two OpenTelemetry Collector distributions for Kafka monitoring, both offering identical functionality with the same configuration files and monitoring capabilities.
- NRDOT Collector (recommended): New Relic's distribution of OpenTelemetry Collector with New Relic support for assistance. For more information, see the NRDOT Collector GitHub repository.
- OpenTelemetry Collector: The upstream community distribution. For more information, see the OpenTelemetry Collector Contrib GitHub repository.
Choose the collector that best fits your support and operational requirements, then proceed to set up monitoring for your environment.

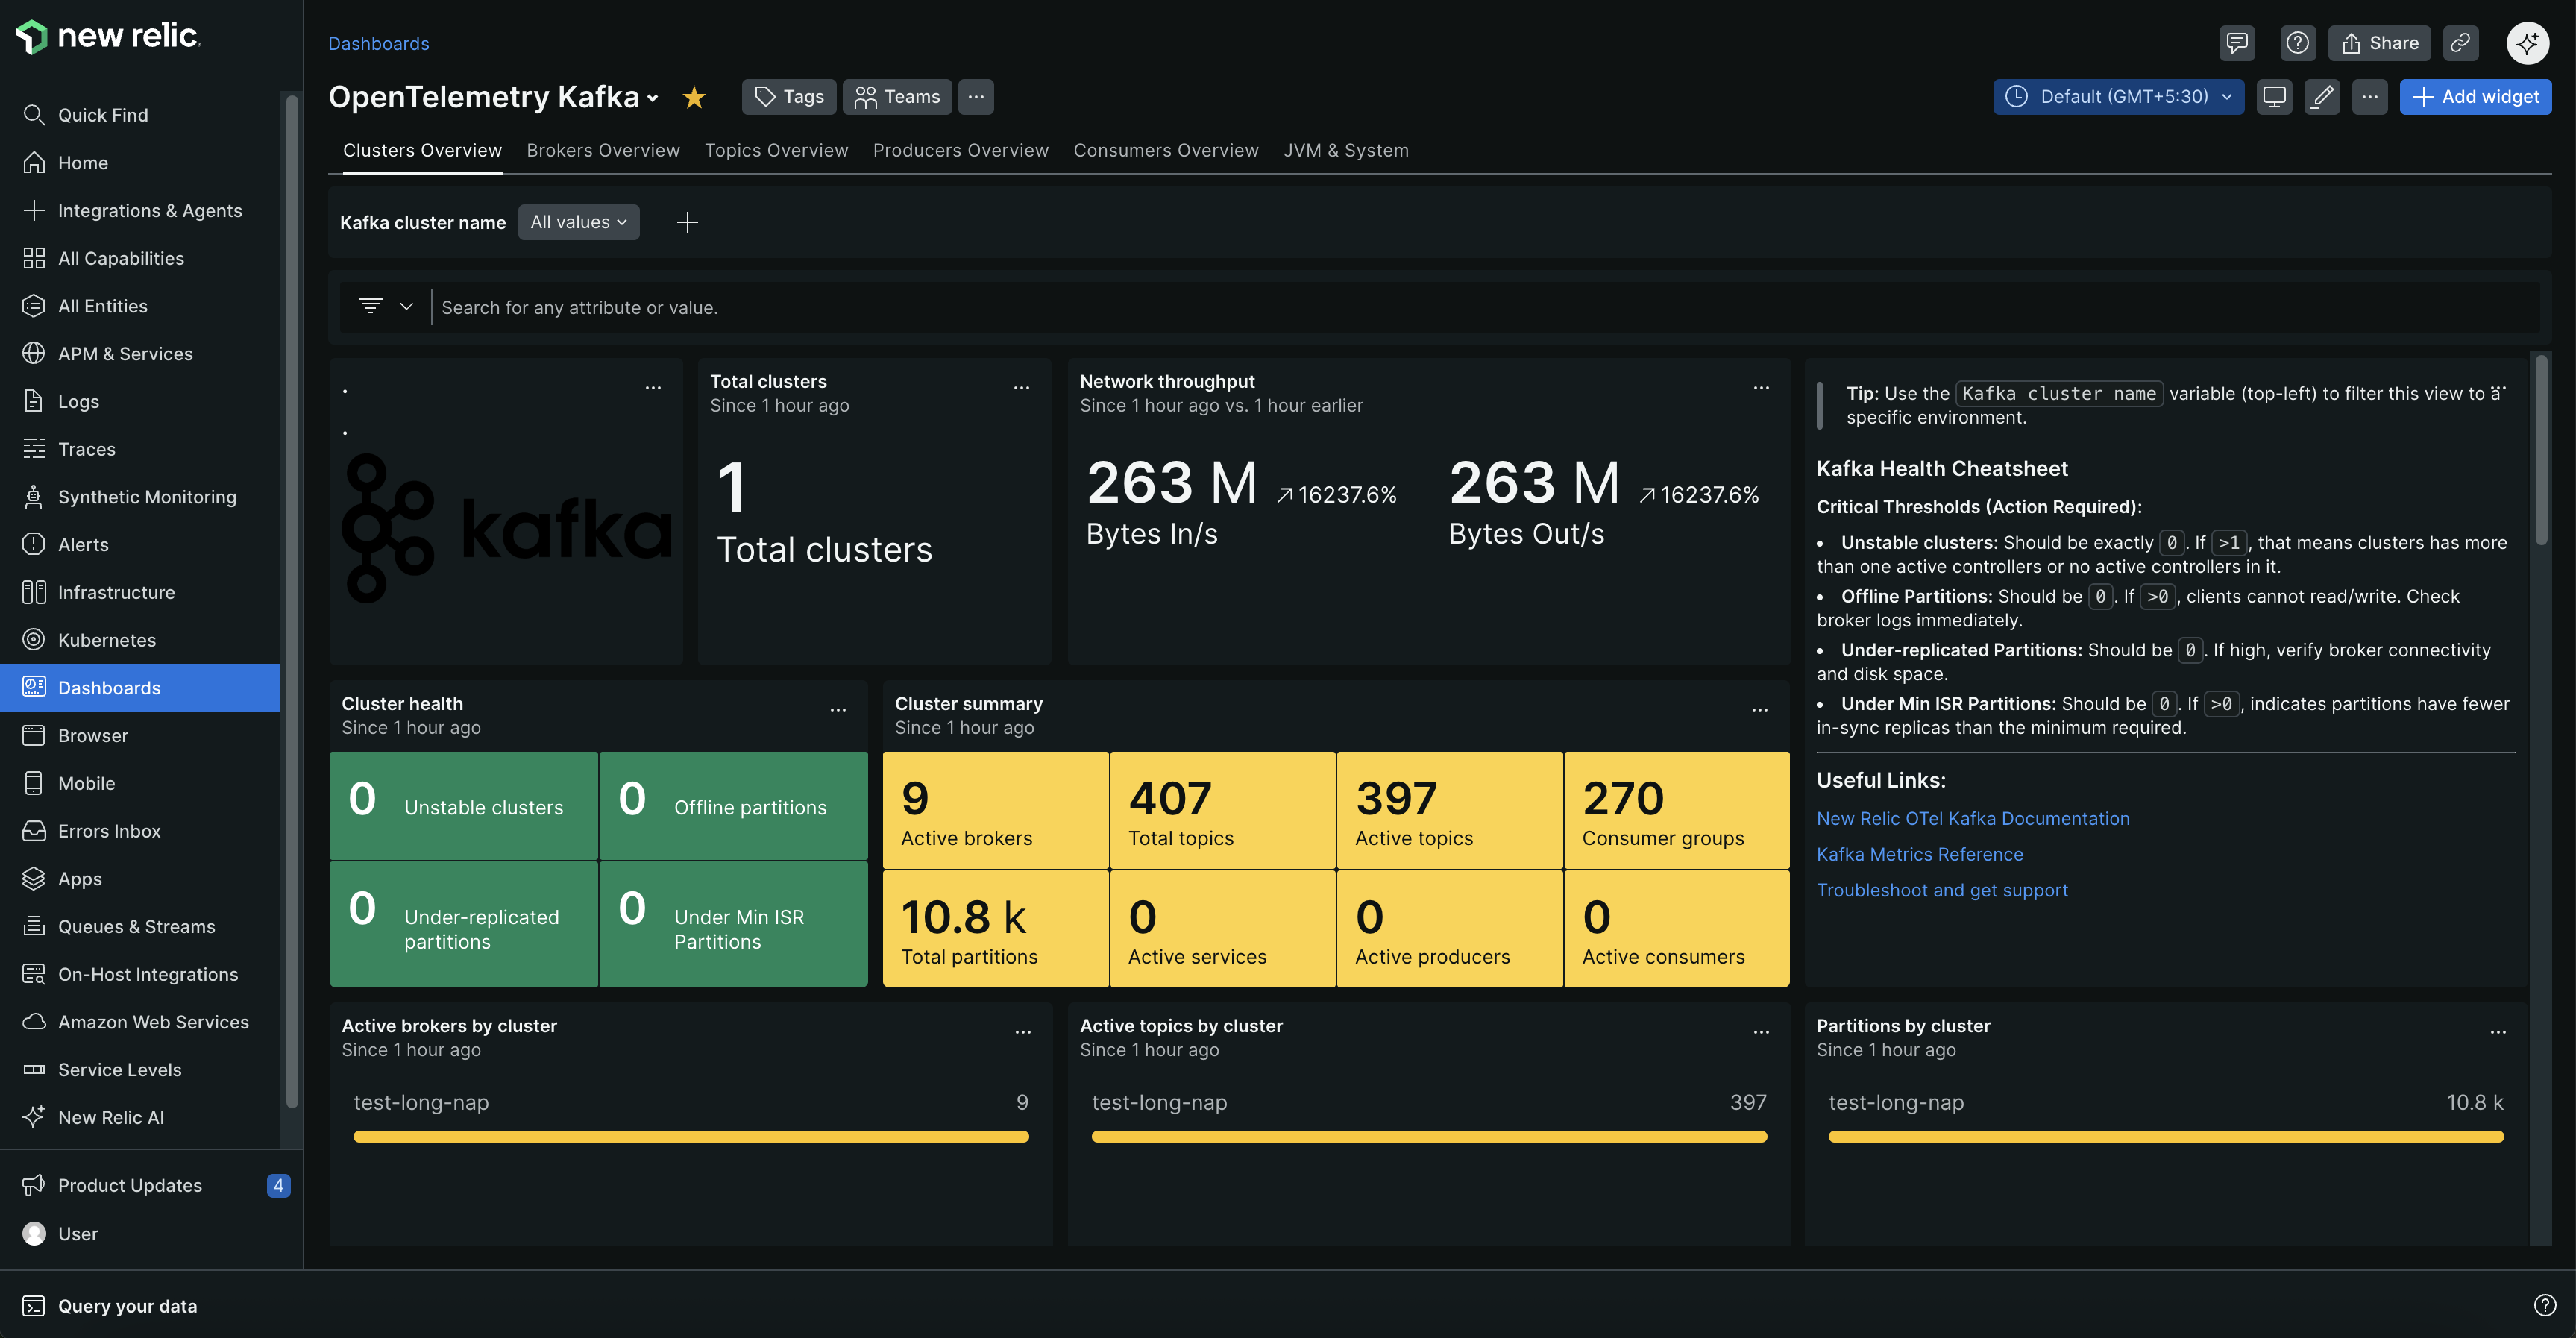
Monitor your Kafka clusters with comprehensive dashboards showing cluster health, broker status, topic metrics, and consumer group performance.
Why Kafka monitoring?
- Prevent outages - Get alerts for broker failures, under-replicated partitions, and offline topics before they cause downtime
- Optimize performance - Identify consumer lag, slow producers, and network bottlenecks that affect data processing speed
- Plan capacity - Track resource usage, message rates, and connection counts to scale proactively
- Ensure data integrity - Monitor replication health and partition balance to prevent data loss
Common use case
Whether you're streaming financial transactions, processing IoT sensor data, or handling microservices communication, Kafka monitoring helps you catch issues before they impact your business. Get alerted when consumer lag spikes threaten real-time dashboards, when broker failures risk data loss, or when network bottlenecks slow down critical data pipelines. This monitoring is essential for e-commerce platforms, real-time analytics systems, and any application where message delivery delays or failures can affect user experience or business operations.
Get started
Choose your Kafka environment to begin monitoring. Each setup guide includes prerequisites, configuration steps, and troubleshooting tips.
How it works
Kafka monitoring works by deploying a collector alongside your Kafka cluster to continuously gather performance data. The collector uses multiple specialized components to capture comprehensive metrics from different parts of your Kafka infrastructure.
Data collection:
- Kafka metrics receiver: Connects to Kafka's bootstrap port for cluster health, consumer lag, topic metrics, and partition status
- JMX metrics collection (broker performance, JVM data, and operational insights):
- Self-hosted Kafka: OpenTelemetry Java Agent with custom JMX configuration runs as a Java agent attached to Kafka brokers, sending metrics via OTLP to the collector's OTLP receiver
- Kubernetes (Strimzi): Prometheus JMX Exporter with New Relic custom configuration exposes metrics on port 9404, scraped by the collector's Prometheus receiver
What you get: Key metrics include consumer lag, broker health, request rates, network throughput, partition replication status, resource utilization, and JVM performance data.
For complete metric names, descriptions, and alerting recommendations, see Kafka metrics reference.
Optional: Add application-level monitoring
The monitoring setup above tracks your Kafka cluster health and performance. To get the full picture of how data flows through your system, you can also monitor the applications that send and receive messages from Kafka.
Application monitoring adds:
- Request latencies from your apps to Kafka
- Throughput metrics at the application level
- Error rates and distributed traces
- Complete visibility from producers → brokers → consumers
Quick setup: Use the OpenTelemetry Java Agent for zero-code Kafka instrumentation. For advanced configuration, see the Kafka instrumentation documentation.
Next steps
Ready to start monitoring your Kafka clusters?
Set up monitoring:
- Self-hosted Kafka - Monitor Kafka running on physical or virtual machines
- Kubernetes with Strimzi - Monitor Kafka deployed on Kubernetes
After setup:
- Find and query your data - Navigate New Relic UI and write NRQL queries
- Explore Kafka metrics - Complete metrics reference with alerting recommendations