Now that you've created a New Relic account, and installed some observability tools, you probably want some tips for getting around the platform.
To access New Relic, go to one.newrelic.com. If you have an EU data center account, go to one.eu.newrelic.com.
Below is a 15 minute video that covers some of the more important New Relic experiences. Note that this video shows how a full platform user would experience the platform.
Below are some details about the topics covered in the video, and links to related docs.
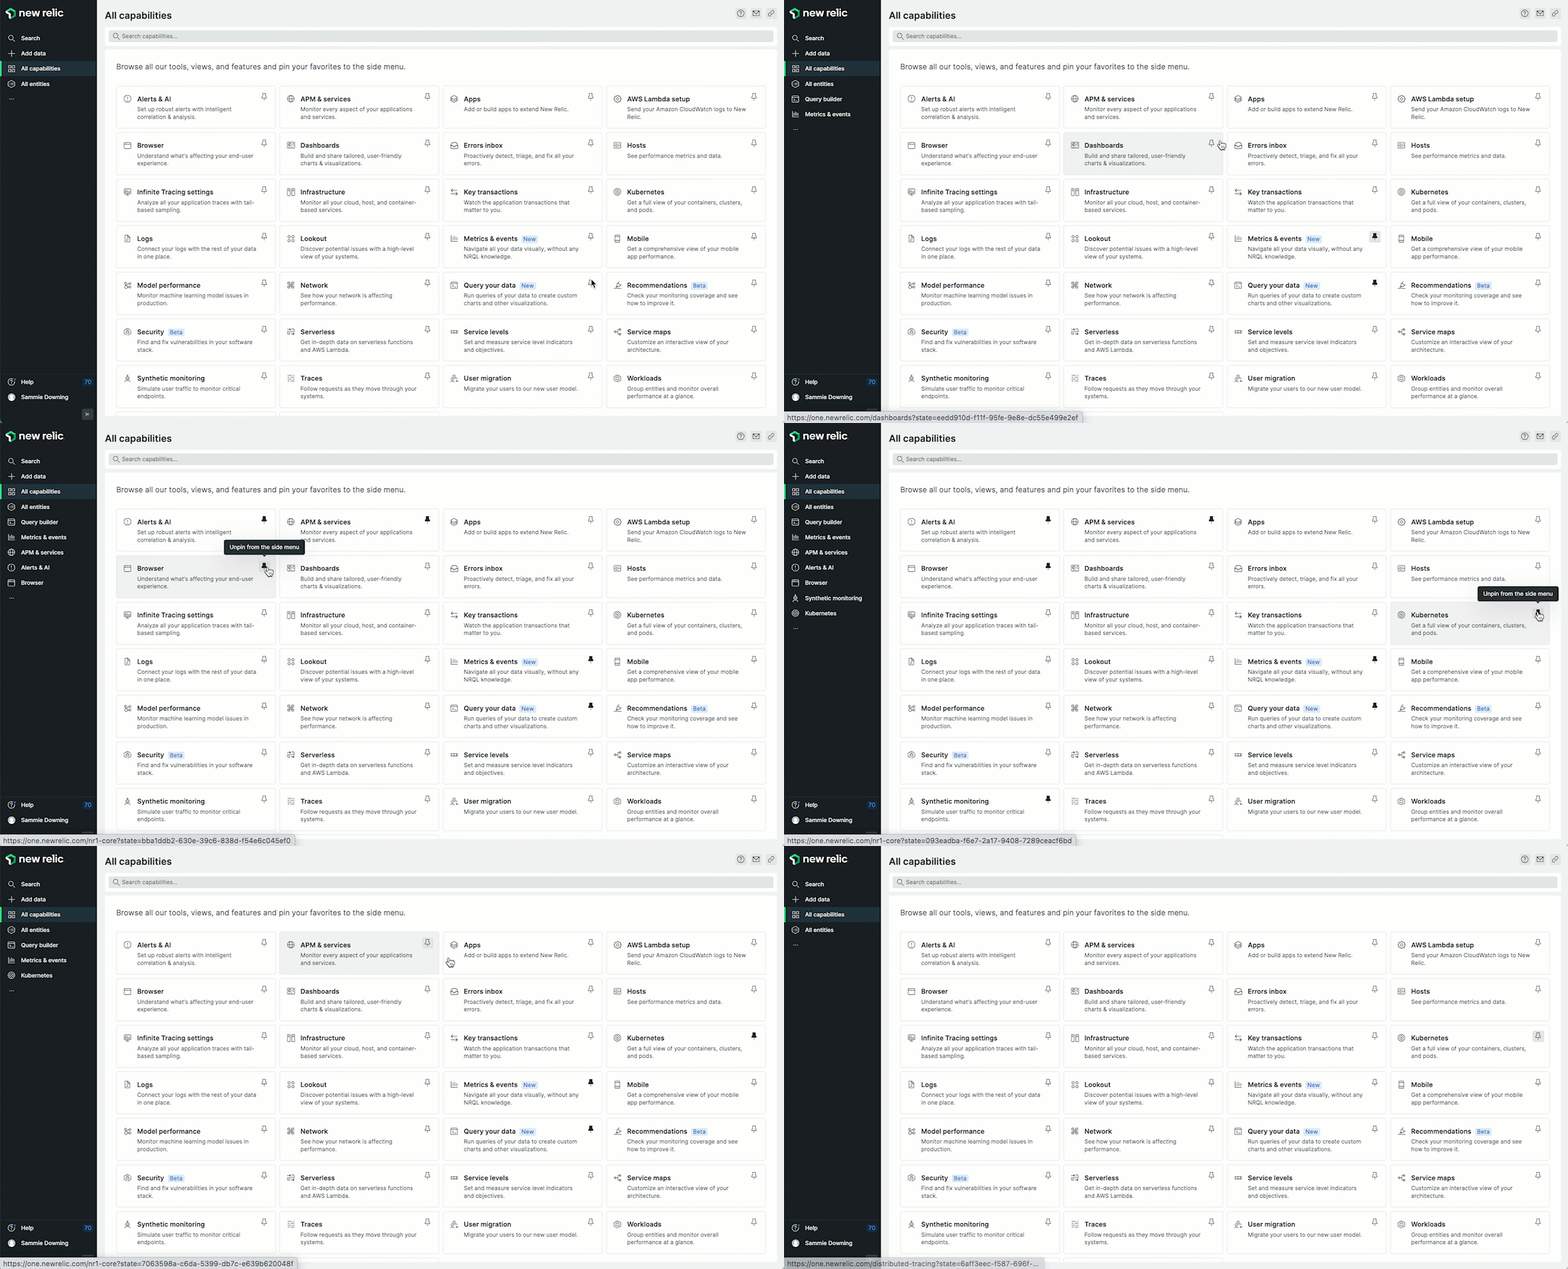
If you're new to using New Relic, you may want to customize your left-side menu. To do that, go to the All capabilities page to find our core features and experiences. You can then pin the capabilities you think you'll often be using.

Some New Relic organizations have more than one account. The account switcher in the top right shows you which account you're in and lets you switch between them. By default, we show you all the accounts you have access to in your organization.
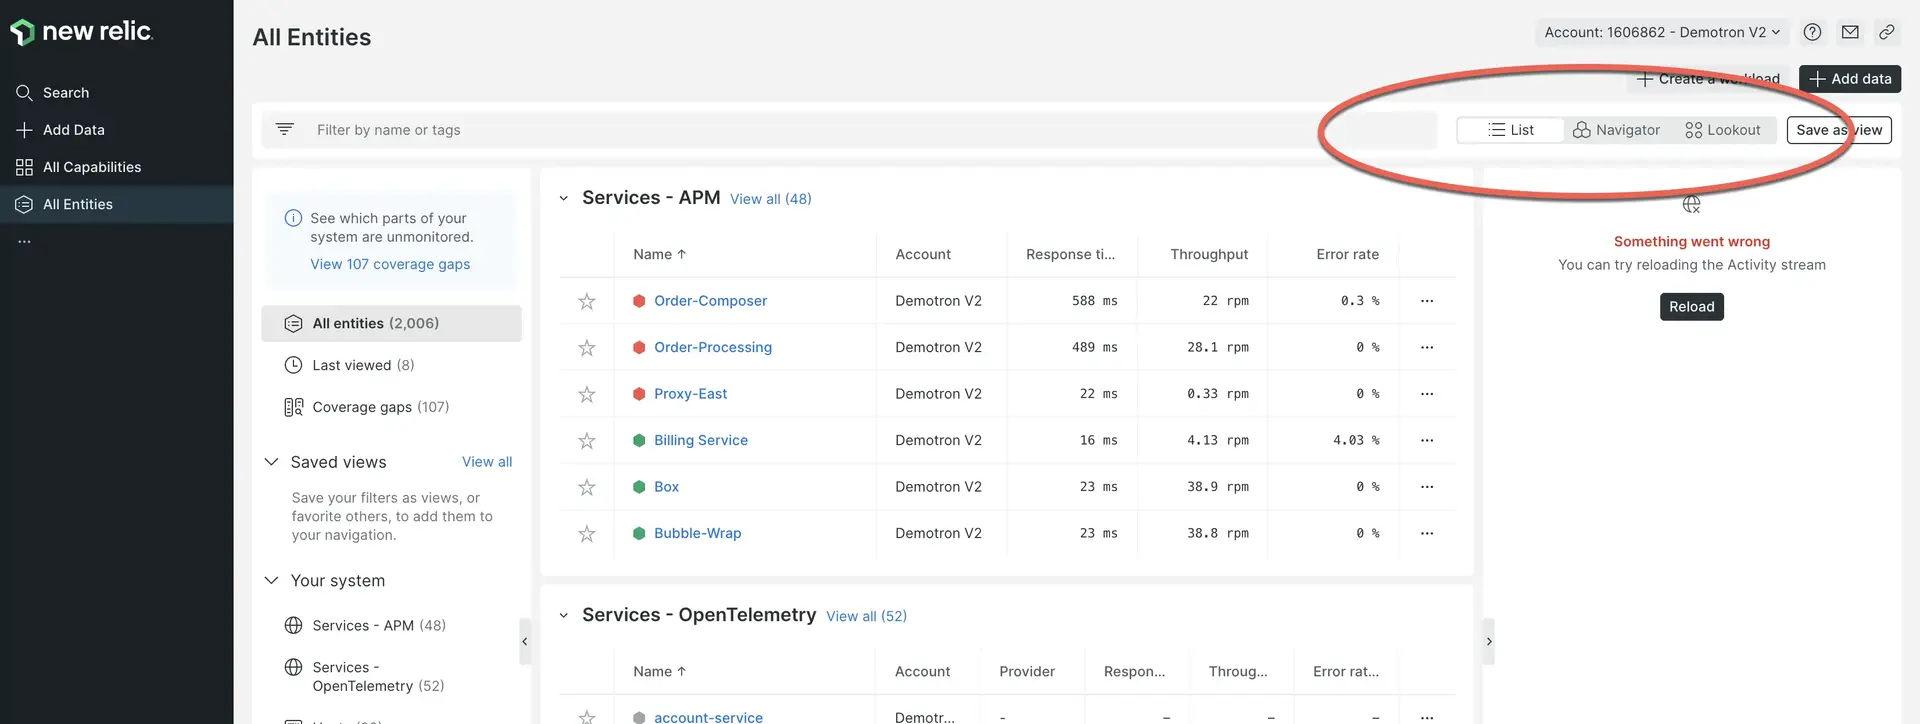
The List, Navigator, and Lookout views help you quickly understand what's going on with your entire system.
To get a sense of how your entire system is doing, click All entities. We use the term entity to refer to something New Relic monitors, whether that's an application, a host, a database service, or something else.
When you click All entities, you're in what we call the entity explorer view, also know as the entity list view. See how List is selected in the upper right?
This view shows you a synopsis of all the things you're monitoring, broken up into categories (learn about these categories). If you have many monitored entities, it may show you only a few in each category, with a priority on those that have had alerting incidents. For any category, you can click View all to see more entities in that category.
Note you can also scroll up and down the left-side entity category menu, as another way to browse all the things you monitor.
From this view, you can switch to the Navigator and Lookout experiences, which are also helpful for understanding your entire system at a glance. Learn more about these high-level views of your system.
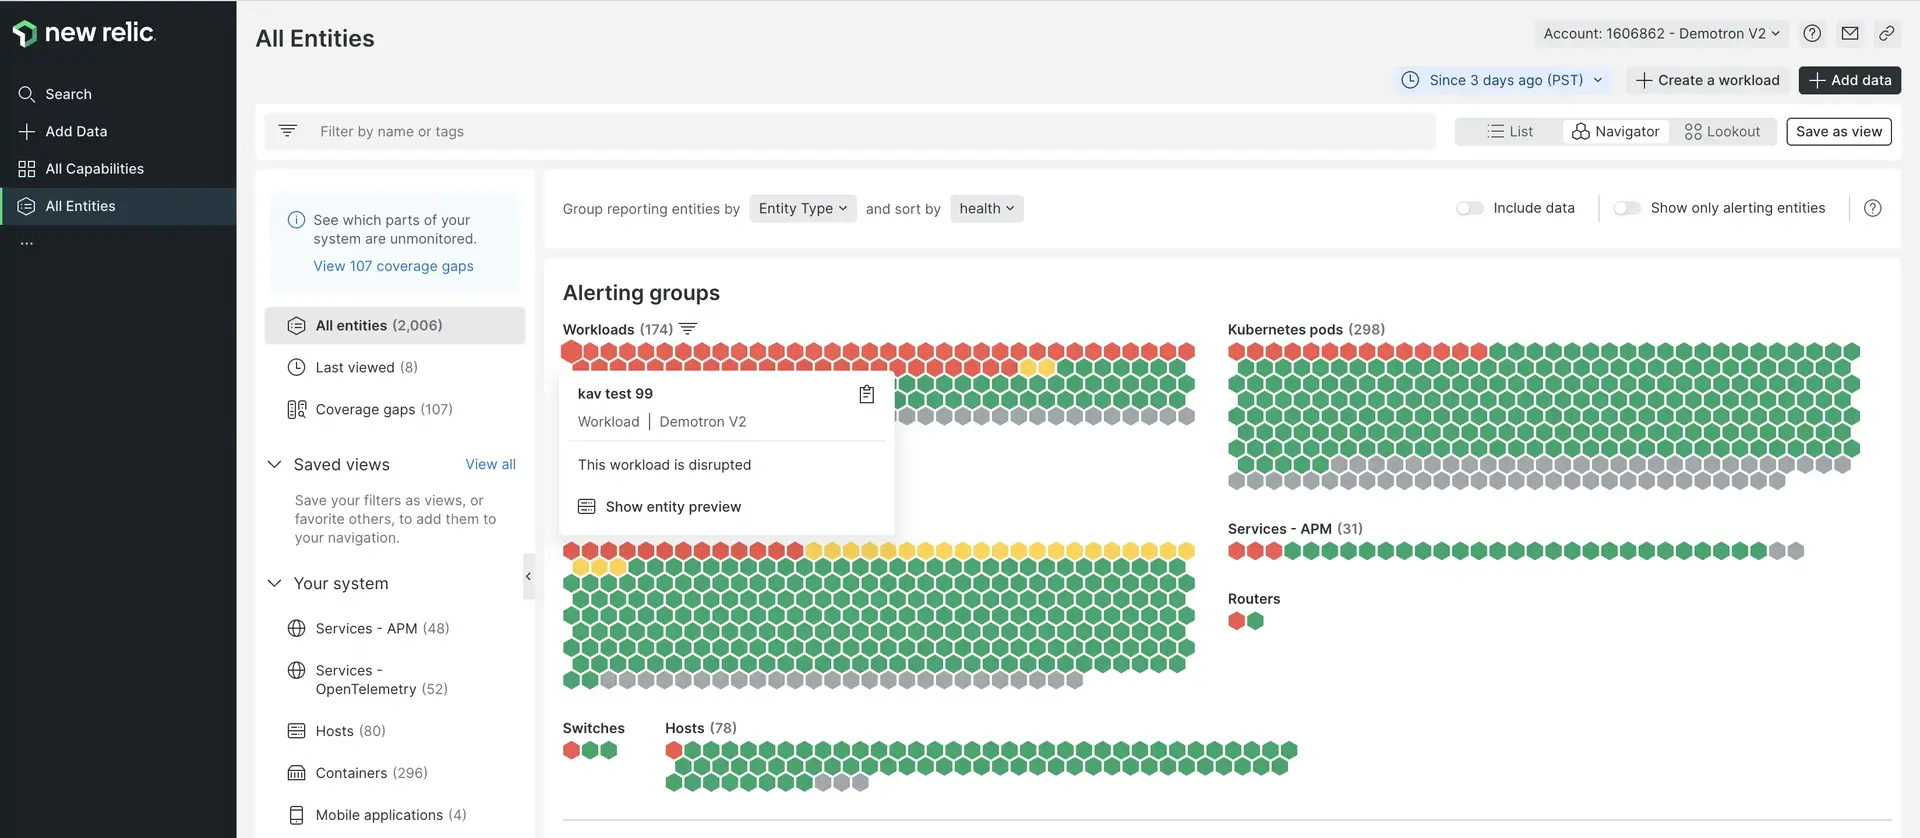
New Relic Navigator is meant to give you a more visual overview of your system based on alerting status. Hover over various entities to see more detail about their status. Learn more about Navigator.
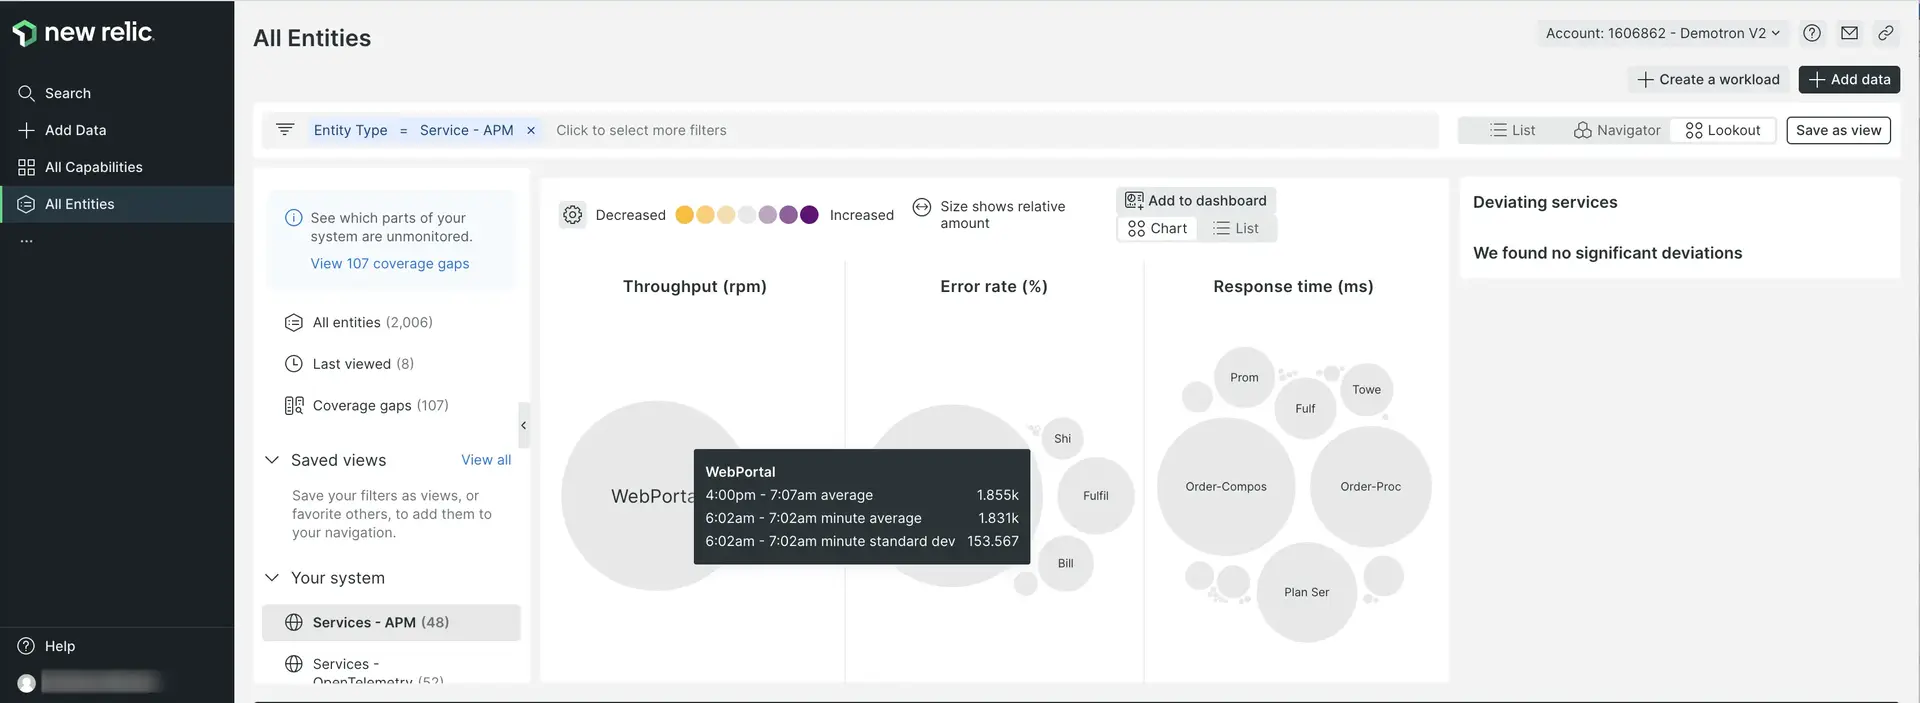
We also have New Relic Lookout, which is another visual way to quickly see how your whole system is doing. This is focused on changes in performances: it draws your attention to entities that have undergone significant shifts in important metrics. Learn more about Lookout.
If you ever want help for a New Relic UI experience, just go up to the top of the page and click the ? icon. That will show you some docs about the specific UI experience you're in.
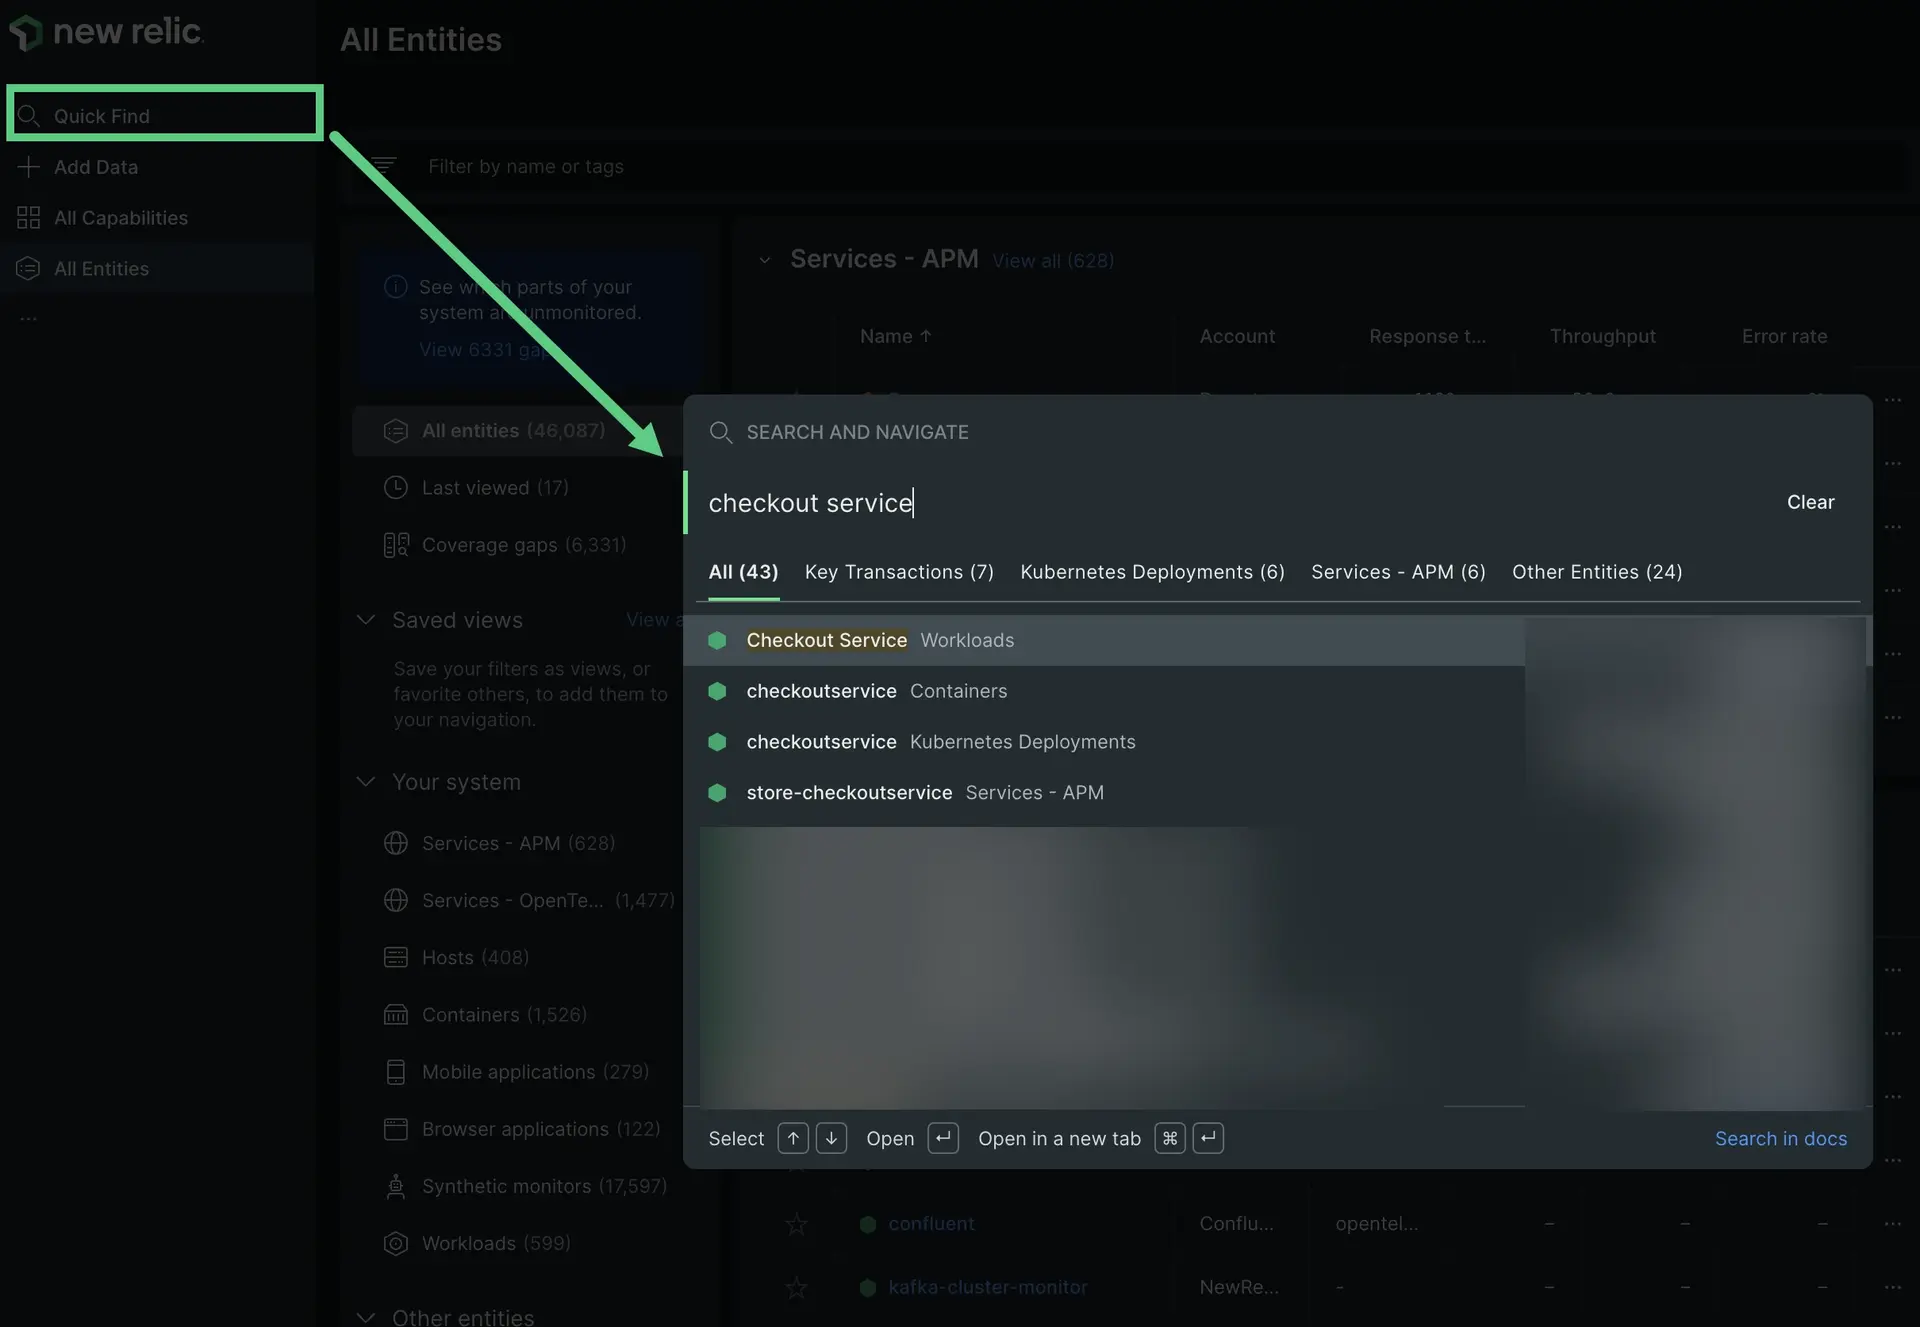
New Relic also has a powerful search functionality. To search, click Quick Find on the left. Whatever you search for, it'll show you where that word appears in different places, such as in your monitored services, in your monitored hosts, in your custom dashboards, and more. The more stuff you're monitoring with New Relic, the more you'll likely be using the search button. For more about how search works, see Search.
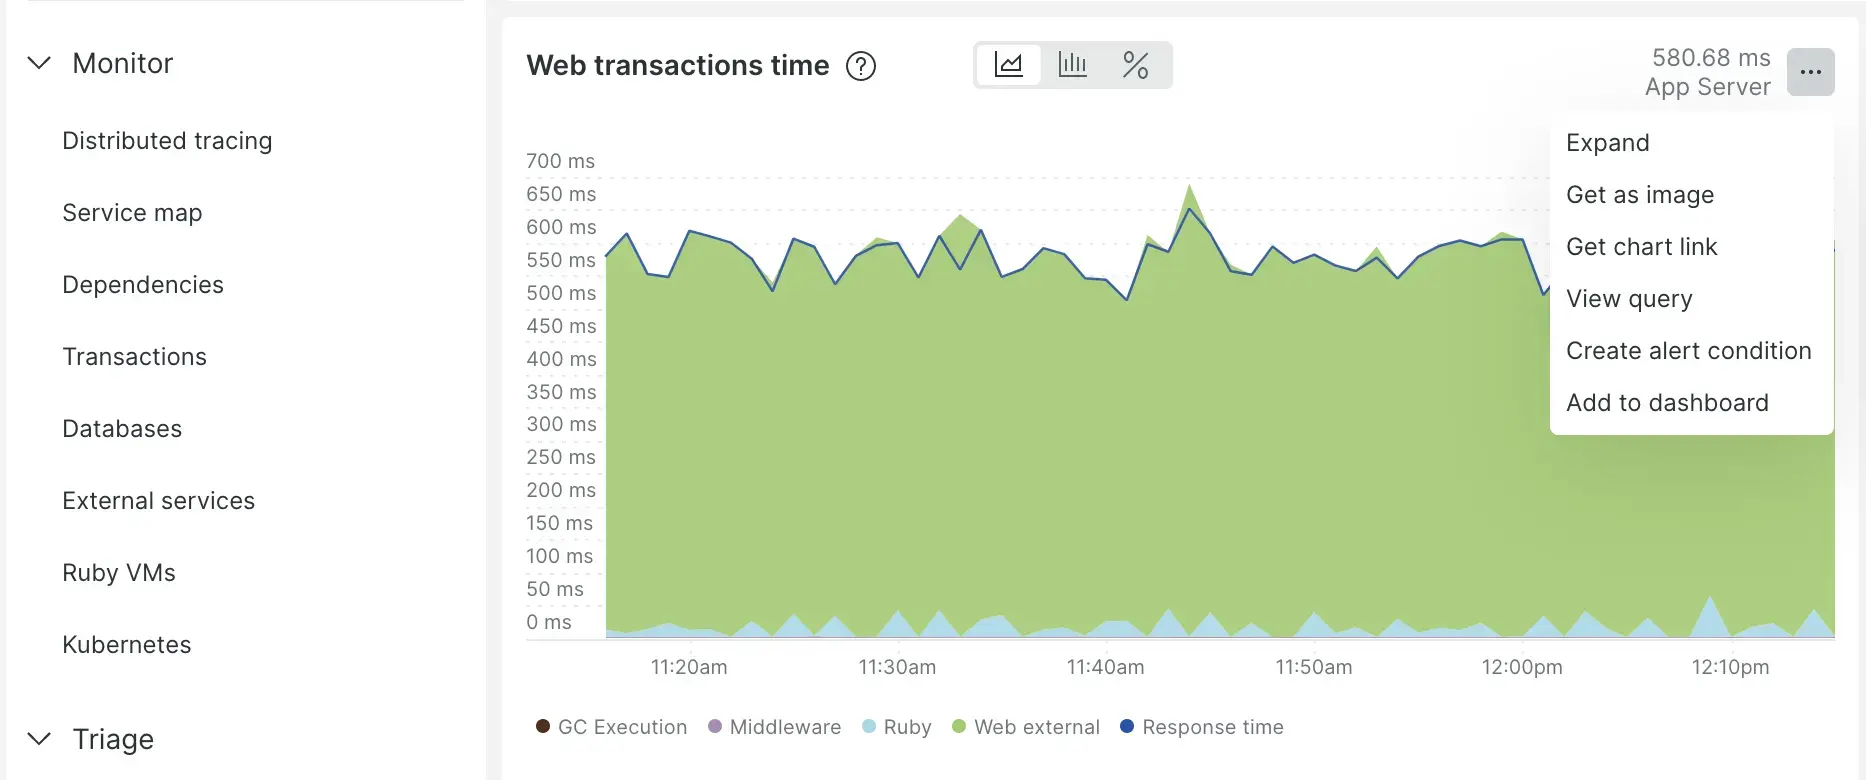
All New Relic charts have various options available, including options for sharing with teammates, options for creating for the metric shown in a chart, and options for seeing and editing a chart's underlying query. Learn more about chart options.
One of the most powerful aspects of New Relic is how it lets you tie together all the components in your system and understand how they're connected. Let's look at a few features related to that.
Distributed tracing
Distributed tracing is powerful for helping you dig down into a specific kind of transaction and see the various calls and components involved in that activity. For more on using this feature, see Distributed tracing.
There are a few ways to get to distributed tracing:
For global distributed tracing, go to: one.newrelic.com > All capabilities > Traces. This shows you traces from across your accounts and entities.
Entity-specific tracing. You can also go to a specific monitored entity (for example, an APM-monitored app) and click Distributed tracing there. That shows you traces that involve that specific entity.
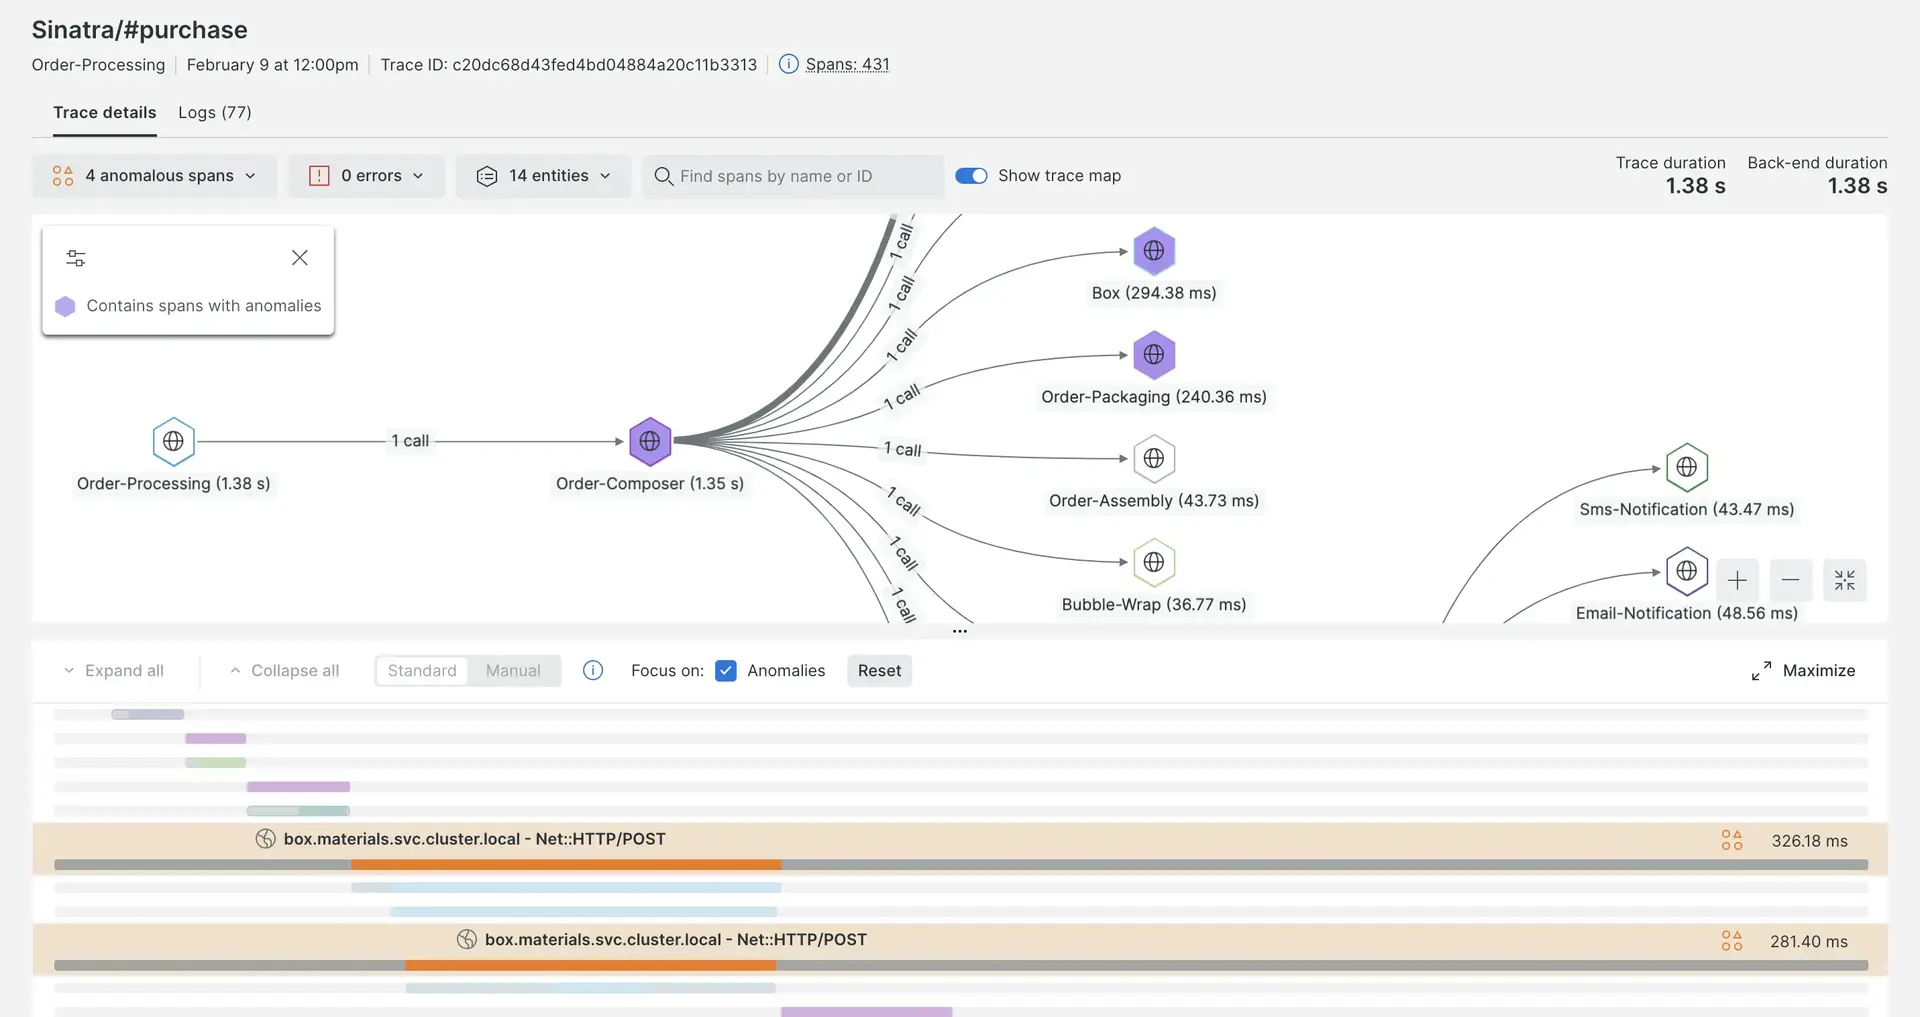
Service maps
When you're in the UI for a specific monitored entity, you can click Service map to see a visual map of how that service relates to other monitored entities. For more details, see Service maps.

Workloads
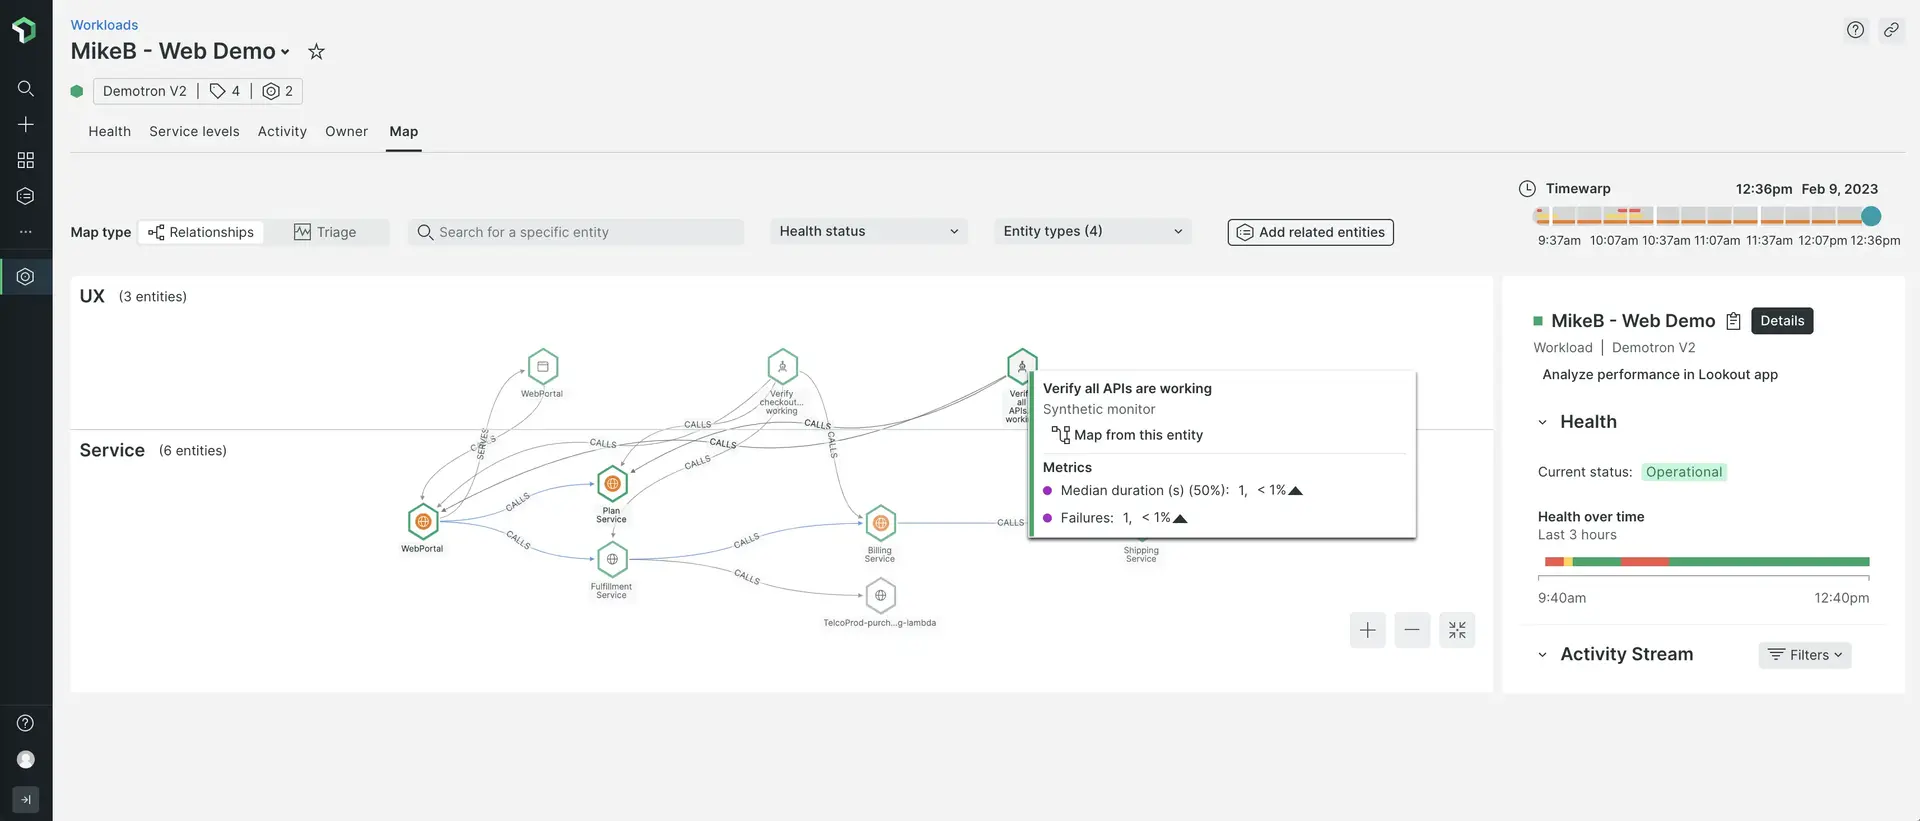
Our workloads feature lets you group together related entities in ways that make sense to your business. This becomes more and more important the bigger your organization is. Here's one of the UI pages you can find in a workload: a map showing the workload entities.
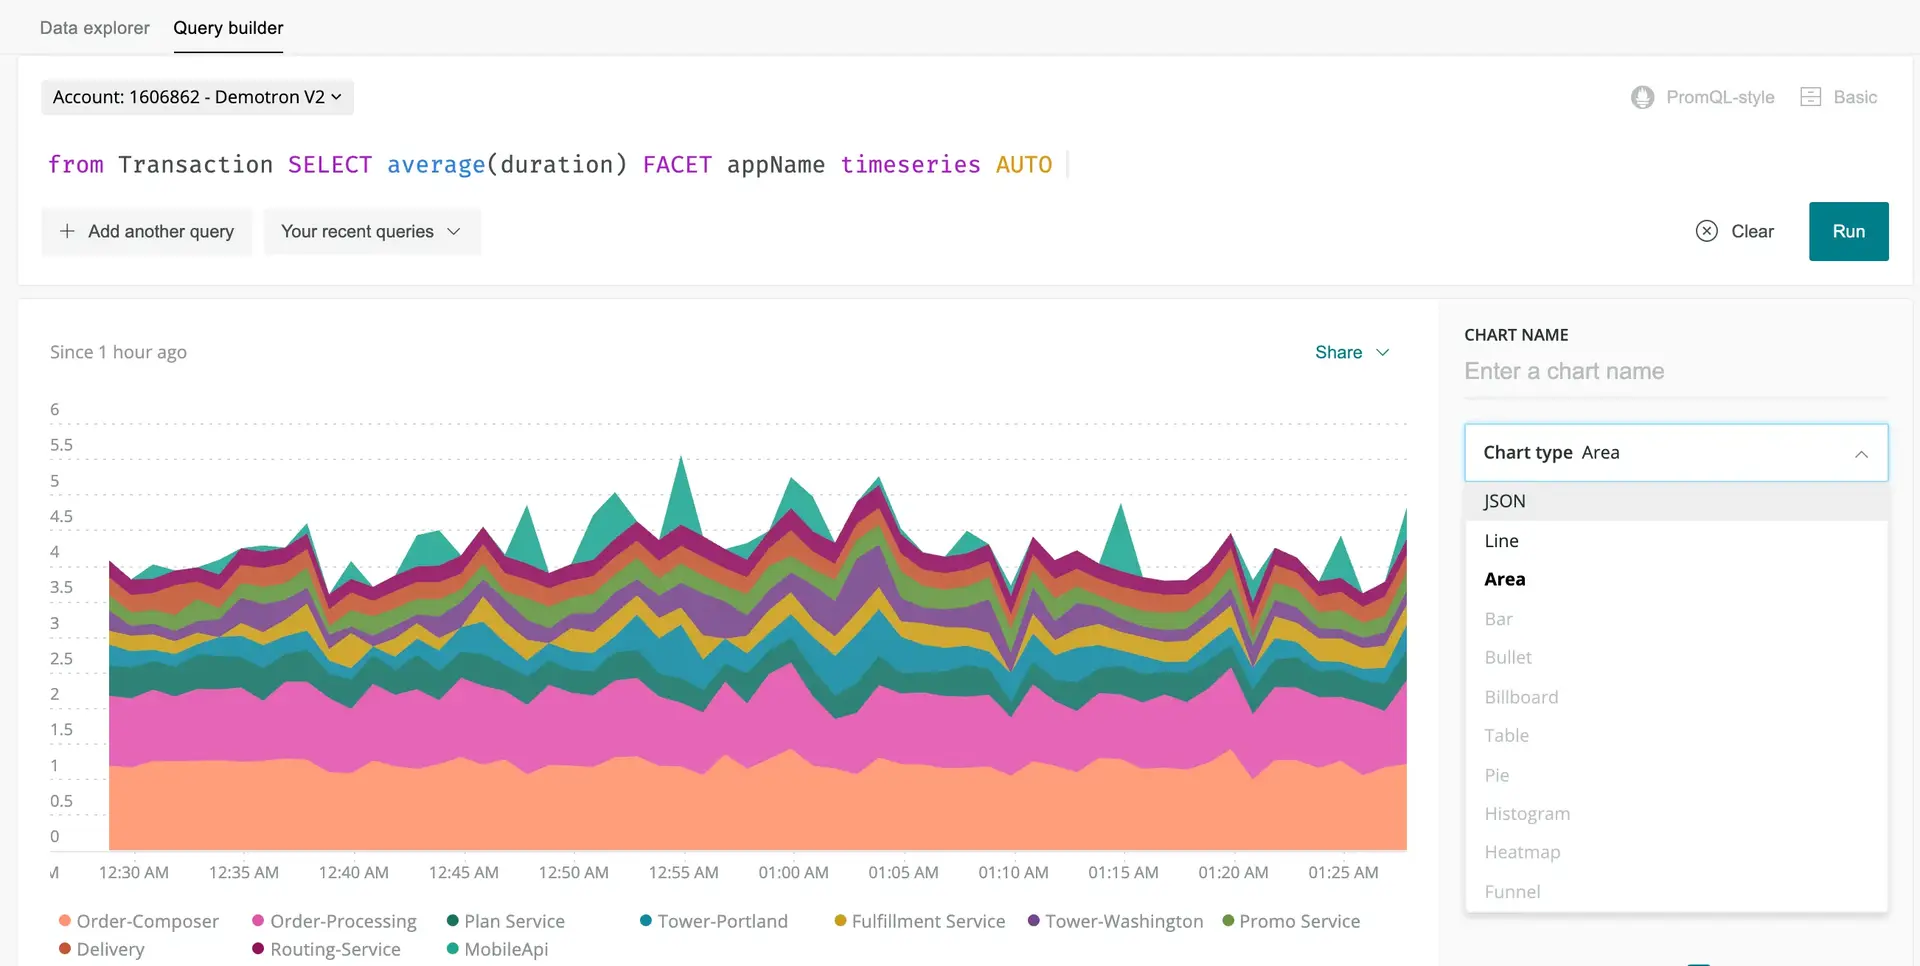
Learning how to query your data will help you get the most out of New Relic. We give you a lot of out-of-the-box UI experiences, but to optimize your observability endeavors you'll likely want to bring in some custom data and make some custom dashboards.
Our query builder uses NRQL: New Relic query language. You don't have to learn NRQL yet. Once you're feeling comfortable with New Relic and are ready to unlock more of its power, you can start exploring our NRQL docs.
You can also explore your data without needed to know NRQL. Go to the Metrics and events explorer to get a visual interface for understanding your data.
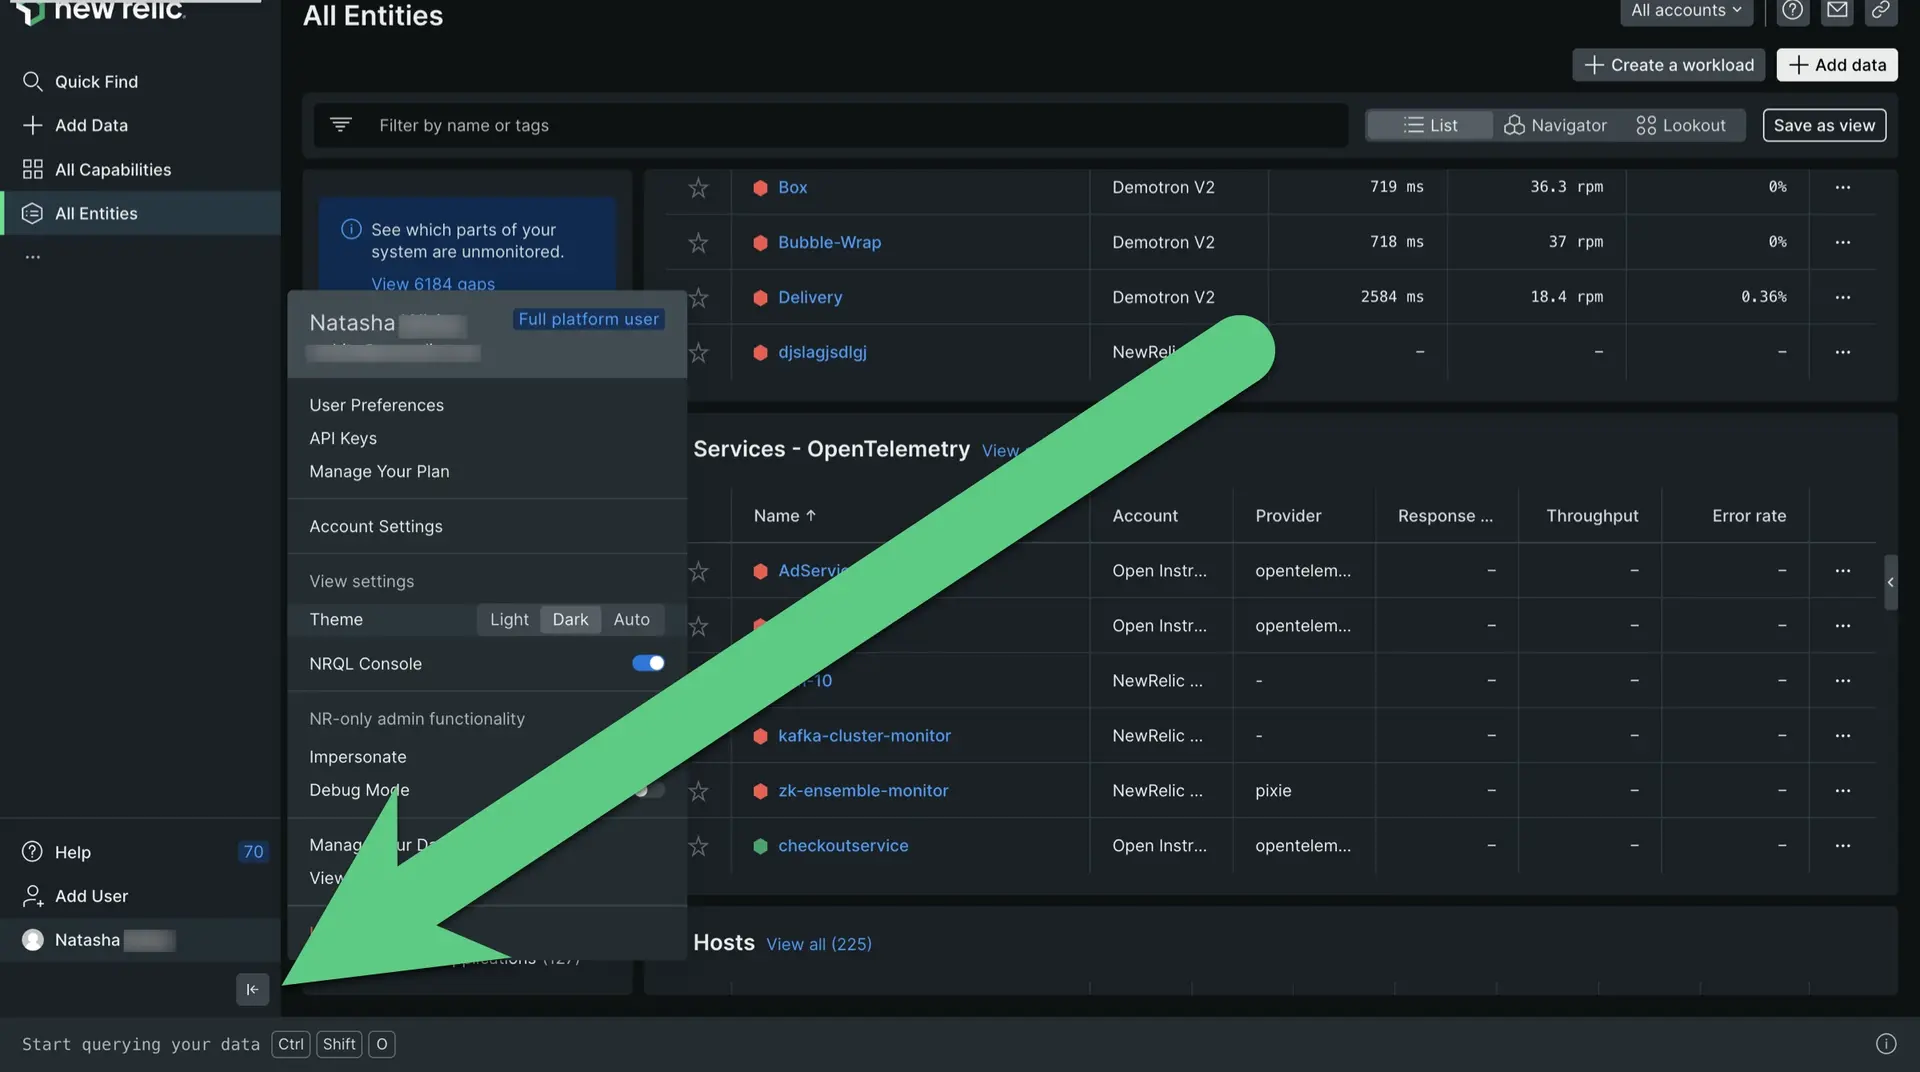
In the lower left corner, you've got your user menu, which gives you access to more administrative options, including options for managing your data and your users. For docs on the options available there, see Account settings.
News and updates
Also, near the user menu, where it says Help, you can access our What's new? posts. These are announcements about exciting new features and important changes.
For an introduction to getting around the New Relic platform, see Get to know New Relic. This doc will go into detail on some of the basic platform experiences, including platform search, chart options, sharing options, and more.
Querying and charting options
Here are some query and chart features available across all or most of the platform:
If you want to... | Do this... |
|---|---|
Start querying your data | Go to one.newrelic.com > All capabilities > Query builder to query your data, or to one.newrelic.com > All capabilities > Metrics & events to explore the data. |
View a chart's query | For most charts, you can view the NRQL query used to generate that chart. This can help you understand a chart better or use it as the basis for a new query. |
Choose time range | Drag across a section of a chart to zoom in on that time range. Or, if you want to select a pre-set time range or use a custom one, use the time picker in the top right corner of the UI. |
View chart details | Mouse over a chart to see a pop-up with more detail. For some charts, selecting a point on the chart will take you to a UI page with more information about that metric. |
Hide or return chart elements | To hide or unhide a displayed chart element, select that element's name below the chart. The chart display will adjust to reflect the absence or presence of that element. |
Share New Relic charts and views with team members
Here are some options for sharing New Relic UI pages and visualizations:
If you want to... | Do this... |
|---|---|
Share an entire UI page | To share an entire New Relic UI page, use the permalink icon near the top of the platform. |
Invite a team member | To invite someone to join New Relic so they can see something or collaborate on a problem, go to the user menu and click Add user. |
Share charts | If New Relic charts are built with NRQL queries, they have a menu that exposes various options, including sharing options like Get as image and Get chart link. |
Some notes about sharing:
- The person you share with may not have access to view the data from that account. To solve that, someone on your team with New Relic user management abilities must add that person to the account.
- If someone can't access a custom dashboard, it may be that it is set to private. Read more about dashboard permissions.
- Some sharing options have associated time ranges, which may impact later viewings of it. For example, if you use a chart's Get chart link option and that chart is set to 'Last 30 minutes', when viewed it will show the last 30 minutes, not the time range displayed when it was shared. To share a specific time range, you must select that time range in the UI.
Search accounts, capabilities and entities
To search across all your New Relic data, click Quick Find at the top of the New Relic UI. From here you will be able to search your entities as well as New Relic capabilities.
Let's say you're a developer for an ecommerce store and you're looking for the service that monitors your cart. You can type Checkout-service into the Search and Navigate field. You'll be able to see all the entities that match that description. Each result will have an alert severity icon so you can quickly see if there are any issues.
But what if you don't remember the name of the entity that manages your cart? You can search for capabilities instead, like APM & Services or Alerts. Capabilities won't have an alert status icon.
- This search looks across all accounts that you've been granted access to in your organization. For more about account access, see Factors affecting access.
- Entities that cease to exist are available in search for eight days.
If your organization has multiple accounts, use the account switcher.
Keyboard shortcuts
You can use keyboard shortcuts to navigate through the UI efficiently.
Action | Shortcut |
|---|---|
Open keyboard shortcut list |
|
Collapse or expand the side menu |
|
Open global search | Mac: Windows: |
Open NRQL console |
|
Focus filter input |
|
Copy permalink | Mac: Windows: |
Go to Integrations & Agents |
|
Go to all entities |
|
Go to all capabilities |
|
Go to help & support |
|
Go to pinned capabilities |
|
Go to add user |
|
Account and user settings
To find account settings and user preferences, use the user menu.
Other UI experiences
This has been a look at a few basic platform UI experiences. For more about the UI, search for docs related to specific New Relic tools and features.