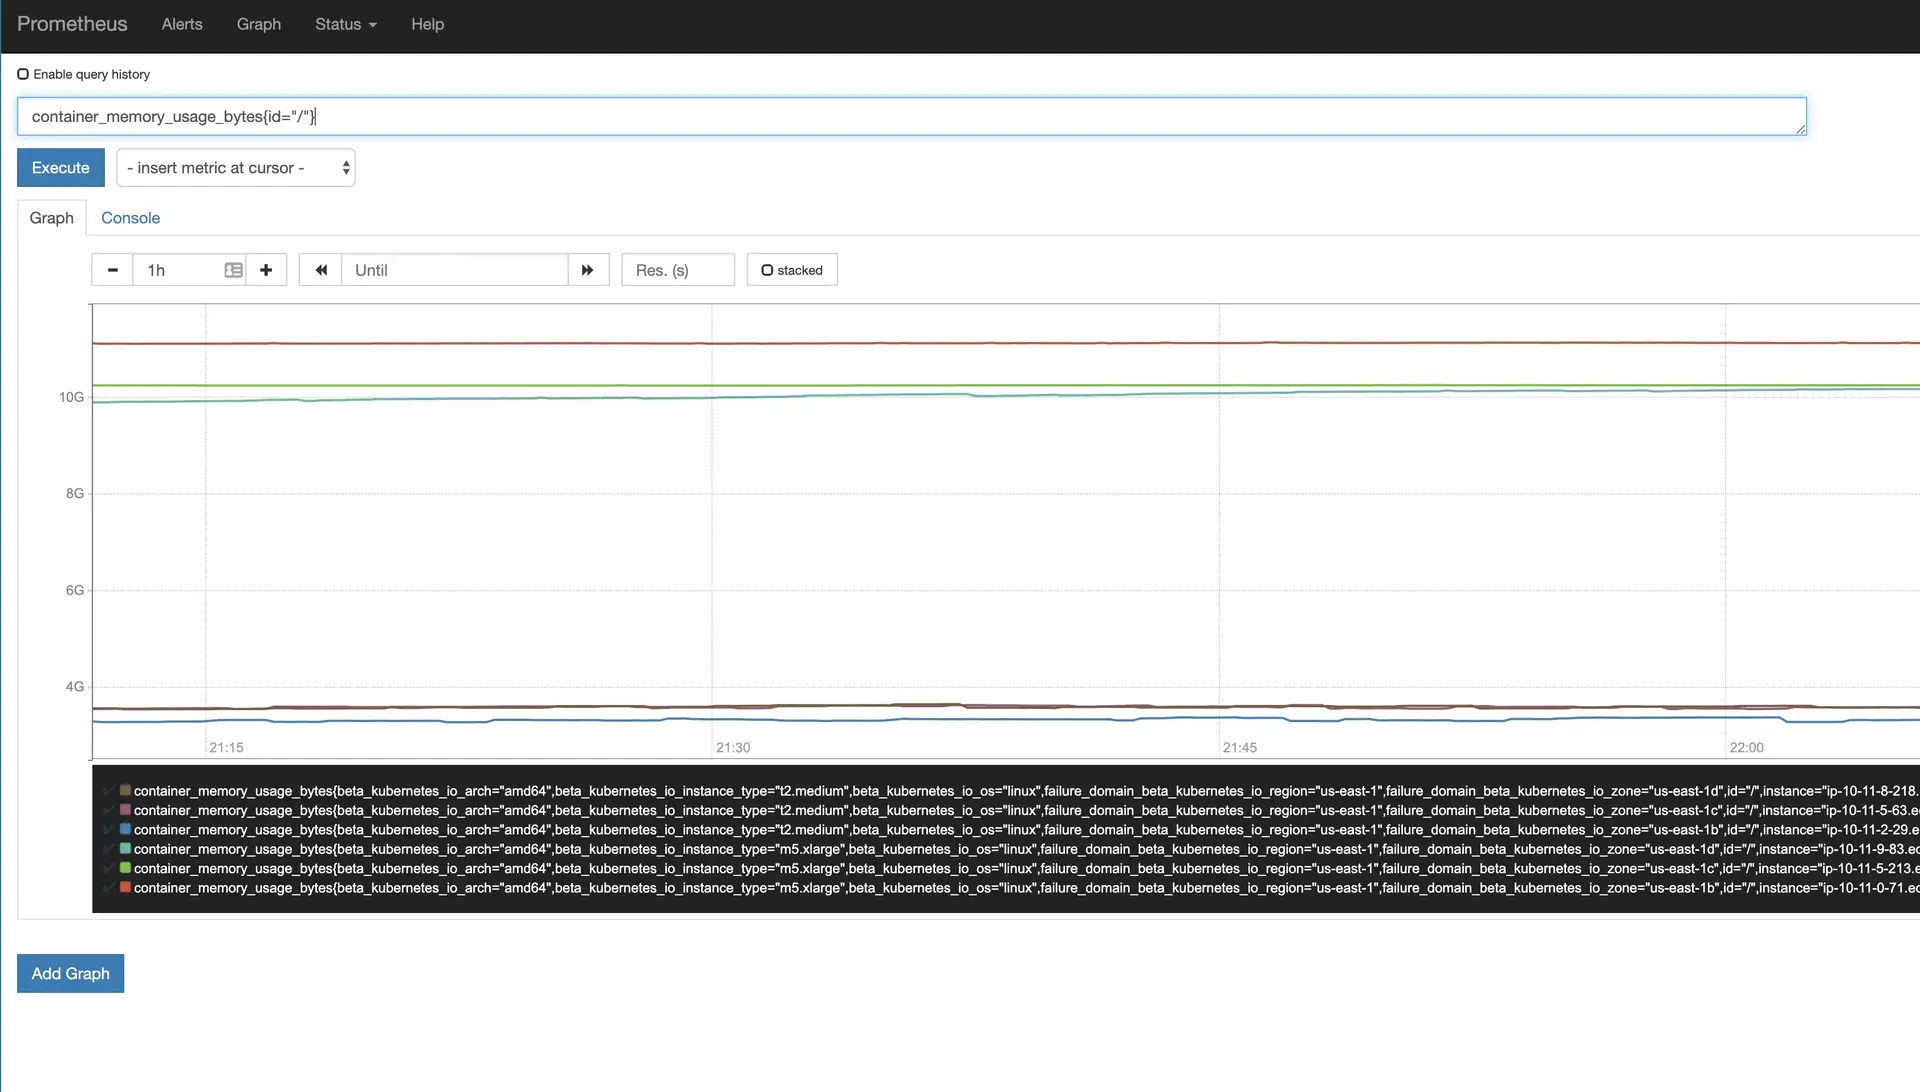
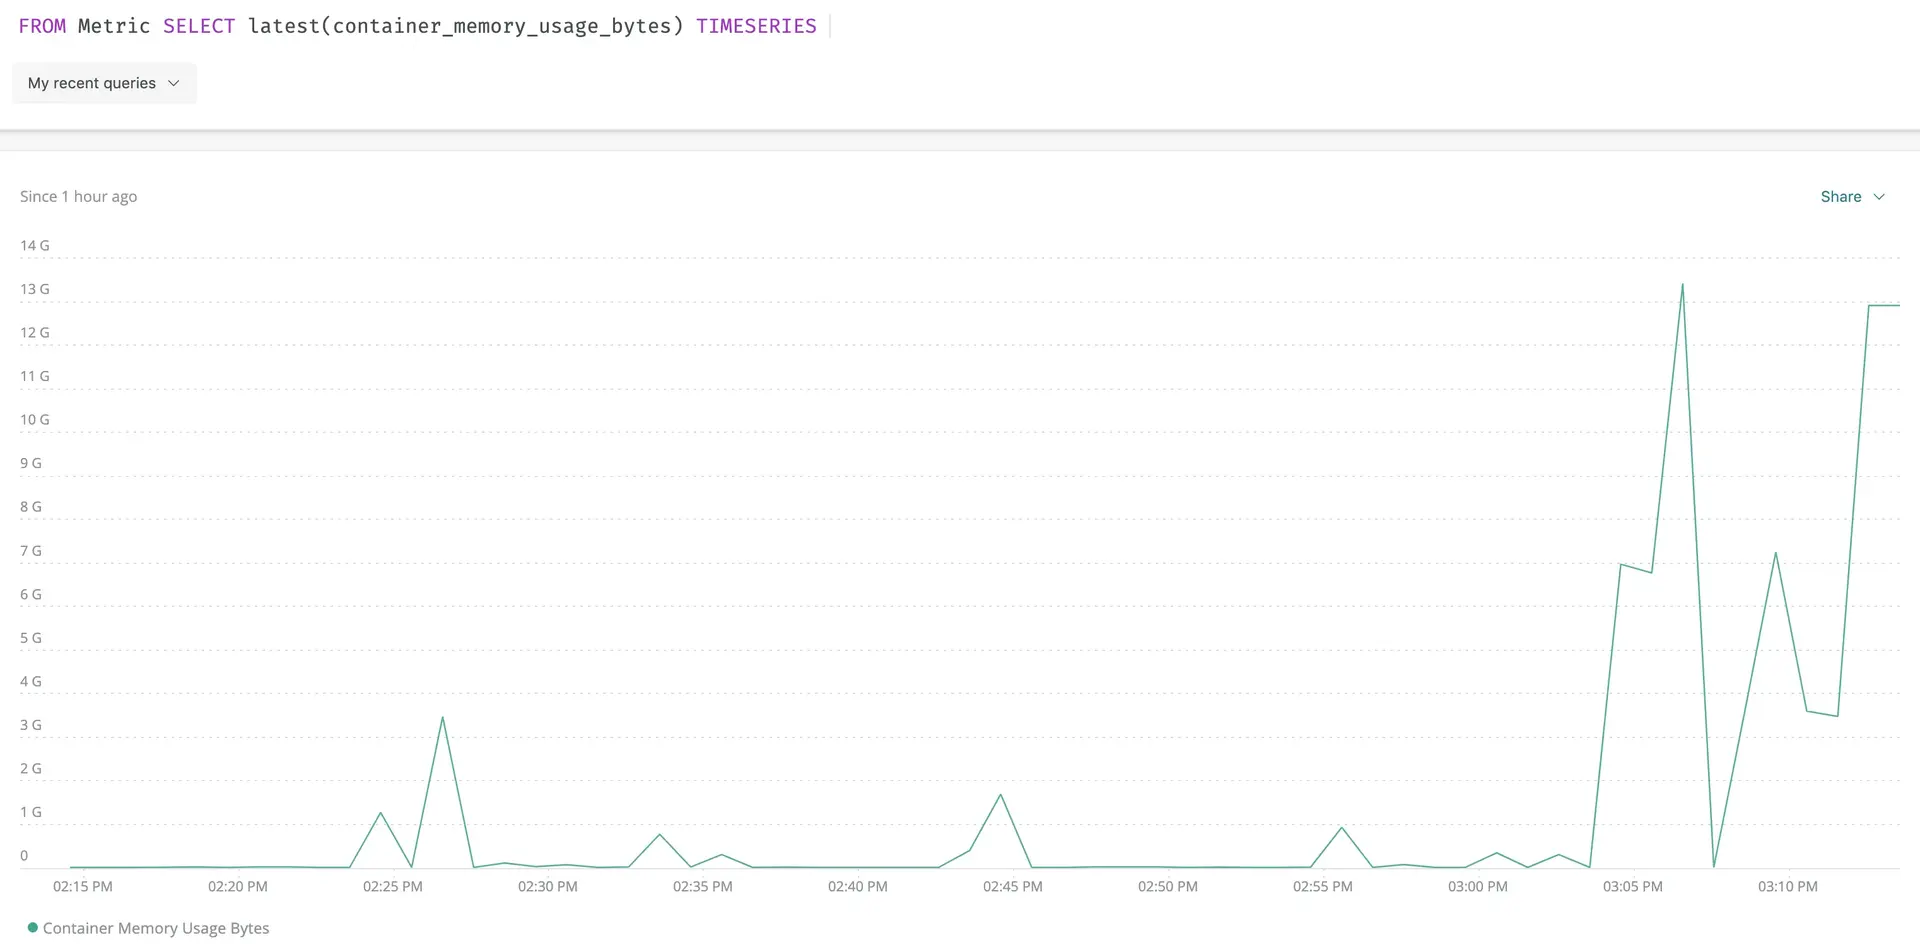
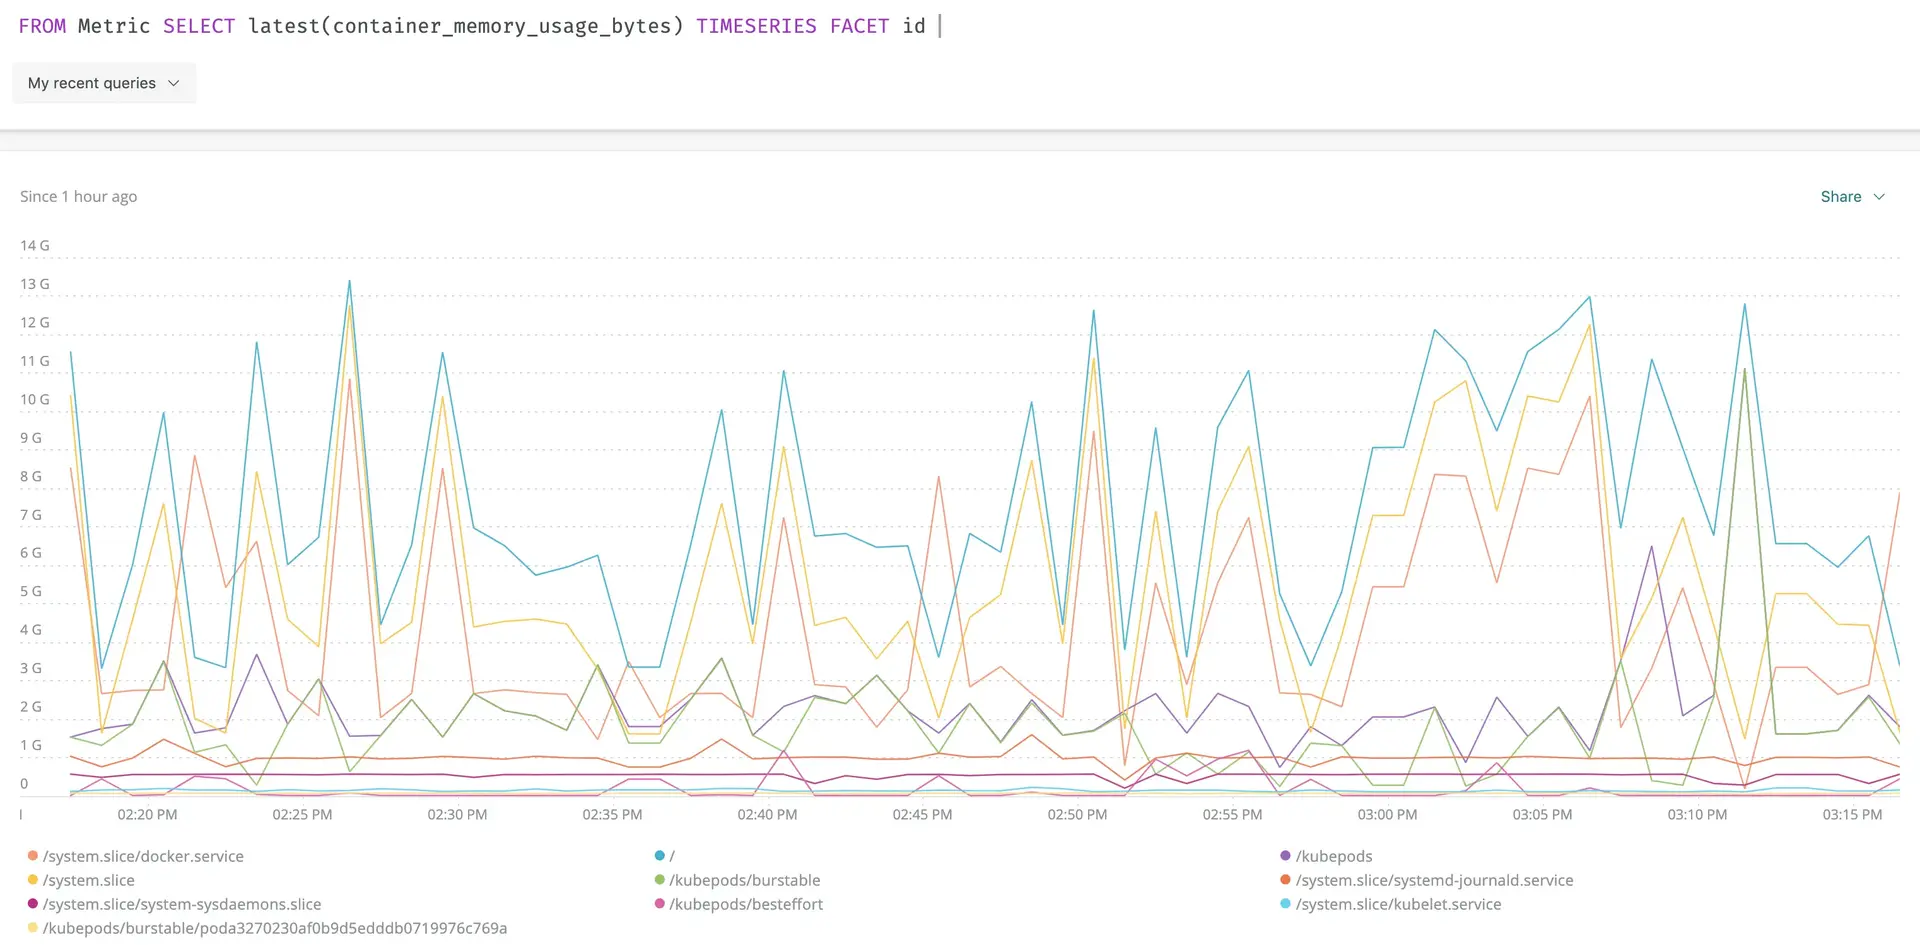
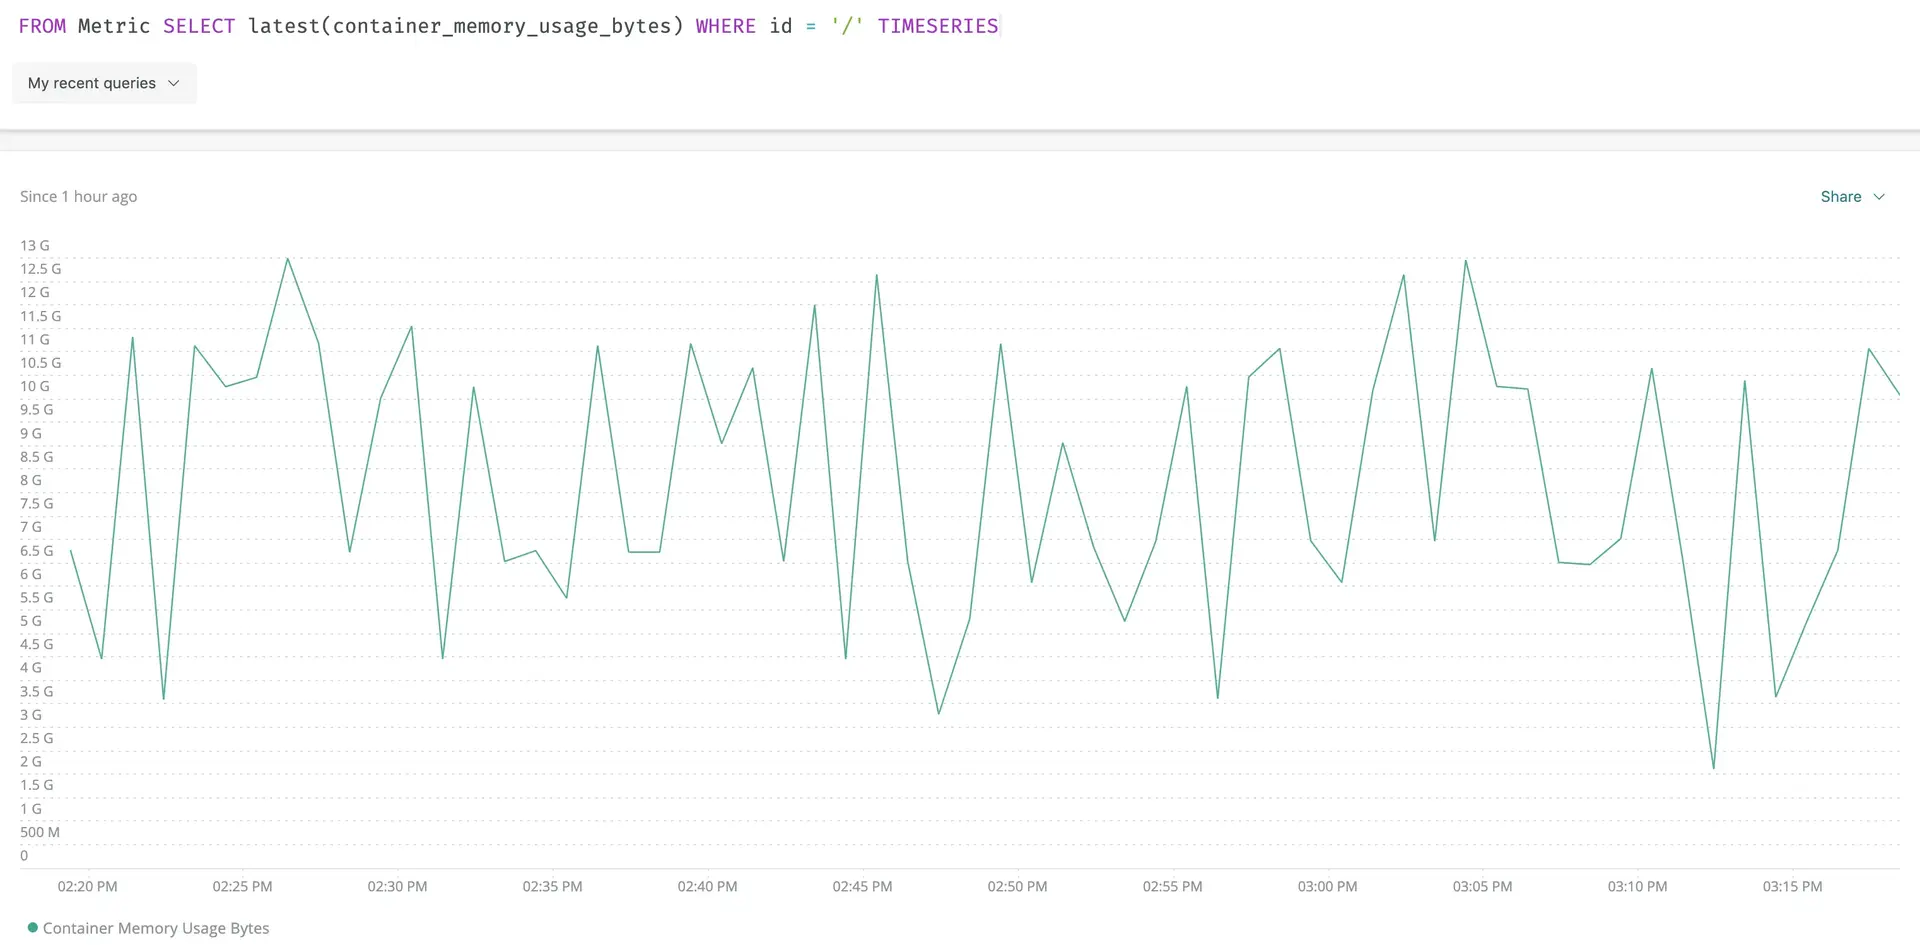
Do you have a PromQL query you'd like to convert to NRQL? This document provides examples that show you how to convert some common PromQL queries to NRQL queries. You can use our PromQL-style query language to explore your Prometheus OpenMetrics integration data along with other data sent to New Relic.
ヒント
To run PromQL-style queries in New Relic, use the PromQL translator in the query builder.
Prometheus and New Relic metric types
The different metric types supported by Prometheus and New Relic are related to each other:
New Relic | Prometheus | Description |
|---|---|---|
Count | Counter | The Prometheus counter is a cumulative sum while the New Relic count is a delta sum. For example, if you see 2 requests in the first reporting period and 3 requests in the second reporting period. The Prometheus counter will report 2 and then 5, while the New Relic count will report 2 and then 3. |
Gauge | Gauge | A Prometheus gauge is similar to a New Relic gauge. |
Multiple counts | Histogram | Prometheus automatically maps a histogram to a set of counters. In New Relic, these counters should be changed to deltas and reported as counts. |
Gauges and counts | Summary | Prometheus represents a Summary with a given
|
Summary | (No equivalent in Prometheus) | New Relic has a distinct metric type called a summary that is different than the Prometheus summary. It is designed for reporting aggregated discrete events so that you can query the count, sum, min, max, and average values. |
Mapping between NRQL and our PromQL-style queries
ヒント
To see how New Relic translates PromQL-style queries to NRQL, write a query in the query builder PromQL-style tab, then switch to the NRQL tab.
This table shows the mapping between NRQL and our PromQL-style queries when exploring data. For more contextual information, see the examples.
Description | Mapping between NRQL and PromQL-style queries |
|---|---|
Search for attributes: Explore the attributes on the |
|
Find attribute's value: Explore the current value of the |
|
Visualize the attribute's value: Chart the value of the |
|
Filter examples
Both our PromQL-style query language and NRQL provide syntax to filter down the number of unique metric time series.
- PromQL-style uses brackets to filter.
- NRQL uses a
WHEREclause.
Here are some example queries:
Description | PromQL-style and NRQL queries |
|---|---|
Select data with specific values. |
|
Select data with multiple values. |
|
Select data using partial string values. |
|
PromQL-style to NRQL query examples
You can simulate the following PromQL-style queries with NRQL queries:
Description | PromQL-style and NRQL queries |
|---|---|
Measure the per second rate over the last minute of the |
|
Chart the difference of the two metrics, then divide by 1024. |
|
Provide the summed rate per 30-second interval by each handler. |
|
Chart the difference in the two metrics where the instance is named |
|


