This page provides an overview of the options for the Prometheus integrations of New Relic and how they work. The information here will help you choose from among our options based on which one best fits your unique business needs.
Prometheus OpenMetrics, Prometheus agent or remote write integration?
We currently offer three alternatives to send Prometheus metrics to New Relic.
- Prometheus Agent for Kubernetes.
- Prometheus OpenMetrics integration for Docker.
- Prometheus remote write integration
If you already have a Prometheus server, we recommend getting started with the remote write integration. Otherwise, depending on your needs, you may choose between the Prometheus Agent for Kubernetes and Prometheus OpenMetrics integration for Docker.
Examine the benefits, reminders, and recommendations for each option below.
Regardless of the option you chose, with our Prometheus integrations:
- You can use Grafana or other query tools via the Prometheus' API of New Relic.
- You benefit from more nuanced security and user management options.
- The database of New Relic can be the centralized long-term data store for all your Prometheus metrics, allowing you to observe all your data in one place.
- You can execute queries to scale, supported by New Relic.
Prometheus Agent for Kubernetes
The Prometheus Agent of New Relic allows you to easily scrape Prometheus metrics from a Kubernetes cluster. By leveraging on the service discovery and the Kubernetes labels, you'll get instant access to metrics, dashboards, and of the most popular workloads.
You can install Prometheus Agent in two modes:
- Alongside the Kubernetes integration: Prometheus agent is installed automatically together with the Kubernetes integration.
- Standalone: If you don't need to monitor your Kubernetes cluster and only want to monitor workloads running on it, you can easily deploy the Prometheus agent just by running a single Helm command. Keep in mind that if you're only using the Prometheus agent, the Prometheus metrics won't be decorated with Kubernetes tags like cluster, pod, or container name.
With this integration you can:
- Automatically get insights from the most popular workloads. Take advantage of predefined set of dashboards and alerts.
- Leverage on service discovery to automatically monitor new services once deployed.
- Query and visualize this data in the New Relic UI.
- Monitor big clusters by using horizontal or vertical sharding.
- Monitor the health of your Prometheus shards and the cardinality of the metrics ingested.
- Full control of the data ingest by supporting different scraping intervals, metric filters, and label management.

Prometheus OpenMetrics integration for Docker
The Prometheus OpenMetrics integrations of New Relic for Docker allow you to scrape Prometheus endpoints and send the data to New Relic, so you can store and visualize crucial metrics on one platform.
With this integration you can:
- Automatically identify a static list of endpoints.
- Collect metrics that are important to your business.
- Query and visualize this data in the New Relic UI.
- Connect your Grafana dashboards (optional).

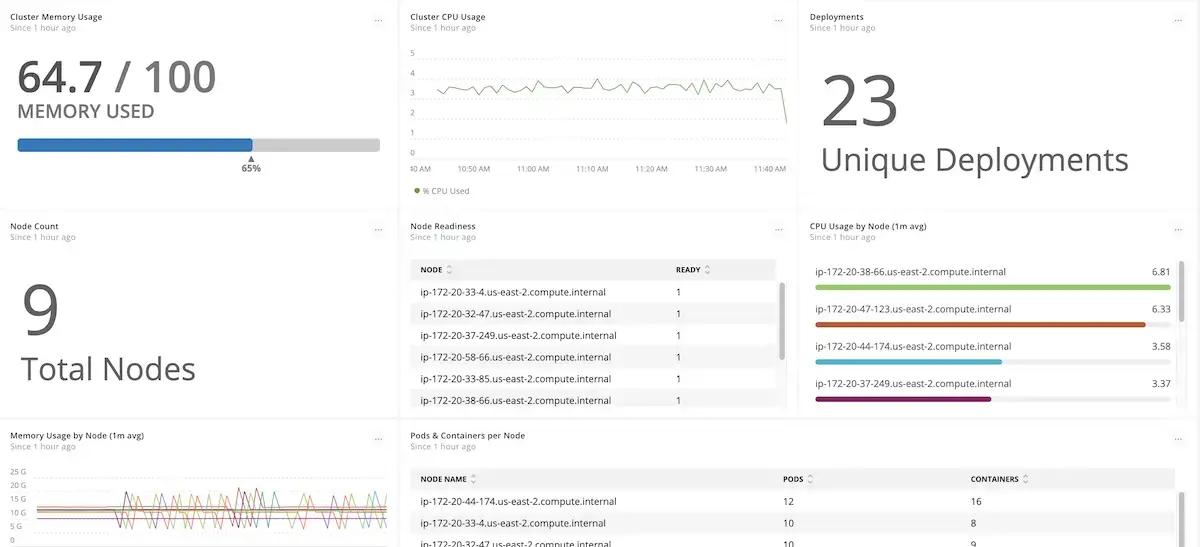
Kubernetes OpenMetrics dashboard
Reduce overhead and scale your data
Collect, analyze, and visualize your metrics data from any source, alongside your telemetry data, so you can correlate issues all in one place. Out-of-the-box integrations for open-source tools like Prometheus make it easy to get started, and eliminate the cost and complexity of hosting, operating, and managing additional monitoring systems.
Prometheus OpenMetrics integrations gather all your data in one place, and New Relic stores the metrics from Prometheus. This integration helps remove the overhead of managing storage and availability of the Prometheus server.
To learn more about how to scale your data without the hassles of managing Prometheus and a separate dashboard tool, see the Prometheus OpenMetrics integration blog post of New Relic.
Prometheus remote write integration
Unlike the Prometheus Agent and Docker OpenMetrics integrations, which scrape data from Prometheus endpoints, the remote write integration allows you to forward telemetry data from your existing Prometheus servers to New Relic. You can leverage the full range of options for setup and management, from raw data to queries, dashboards, and beyond.
Scale your data and get moving quickly
With the Prometheus remote write integration you can:
- Store and visualize crucial metrics on a single platform.
- Combine and group data across your entire software stack.
- Get a fully connected view of the relationship between data about your software stack and the behaviors and outcomes you're monitoring.
- Connect your Grafana dashboards (optional).

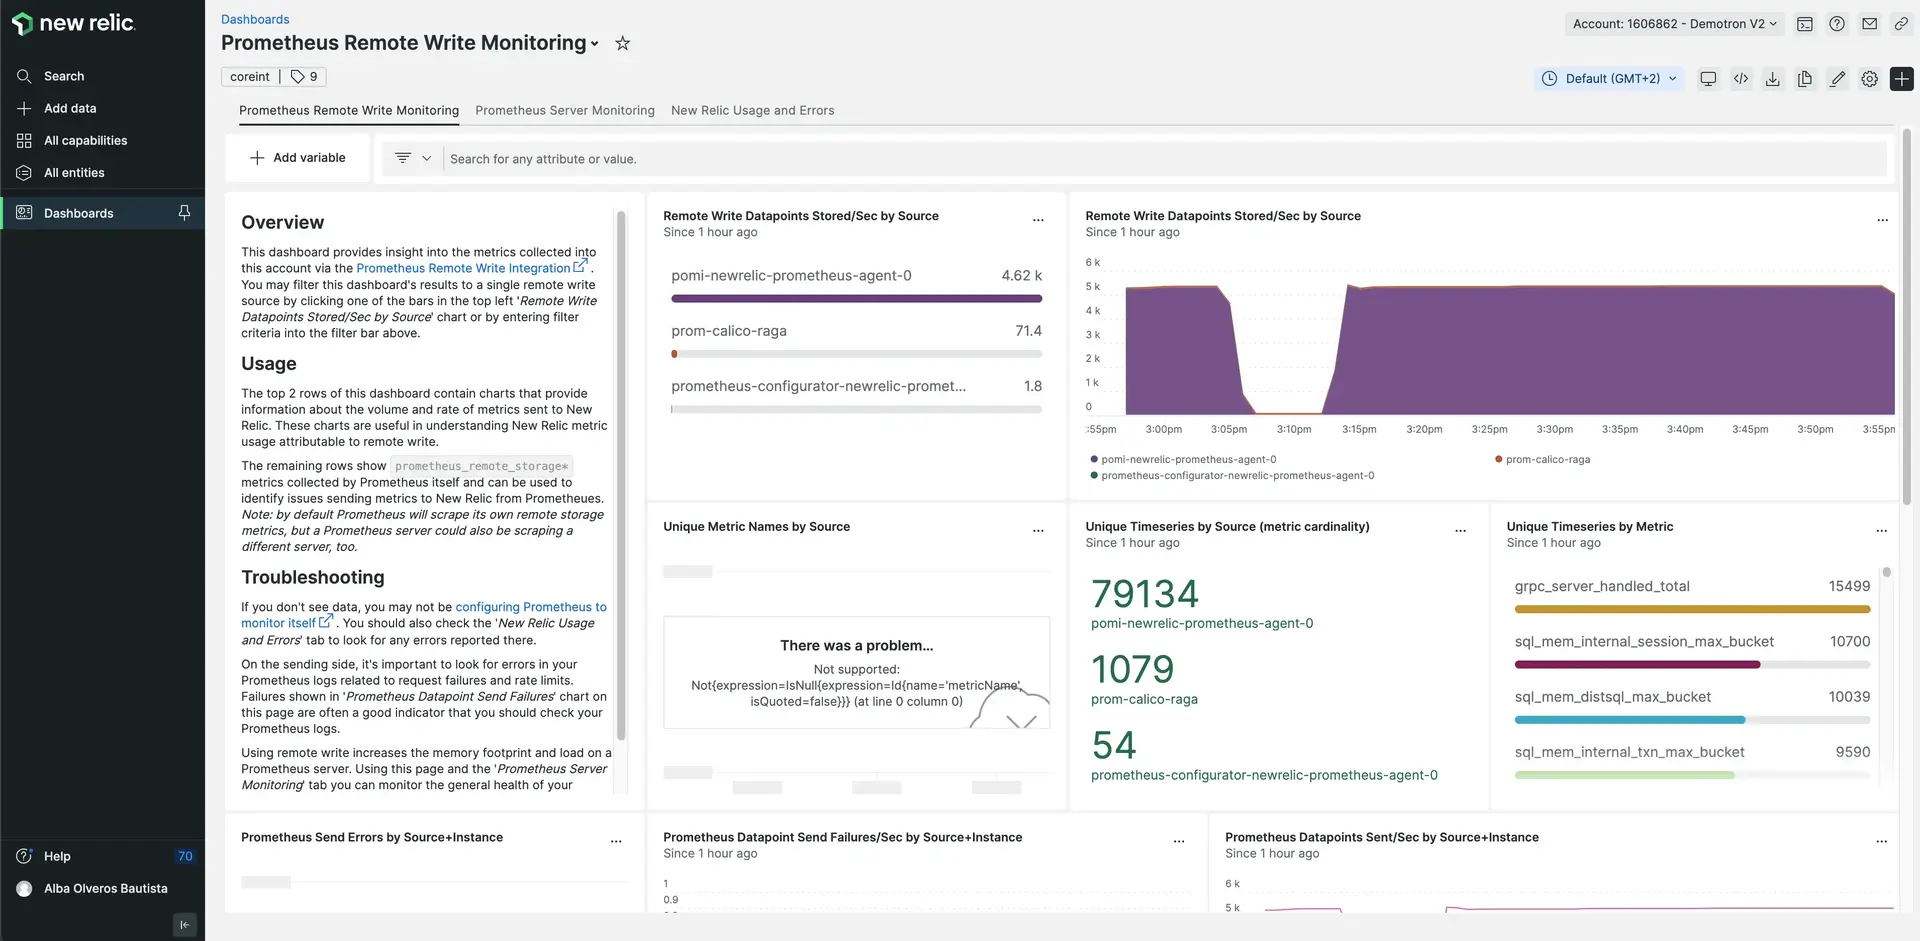
Prometheus remote write dashboard.
How it works
Signing up for New Relic is fast and free — we won't even ask for a credit card number. Once logged in, you can get data flowing with a few simple steps.
What's next
Ready to get moving? Here are some suggested next steps:
- Read the how-to for completing the Prometheus Agent for Kubernetes.
- Read the how-to for completing the Prometheus OpenMetrics integration for Docker.
- Read the how-to for completing the remote write integration.
- Remote write and Prometheus OpenMetrics integration options generate dimensional metrics that are subject to the same rate limits described in the Metric API.
- Learn about Grafana support options, including how to configure a Prometheus data source in Grafana.
- Prometheus documentation for the list of all possible exporters created by the open source community.