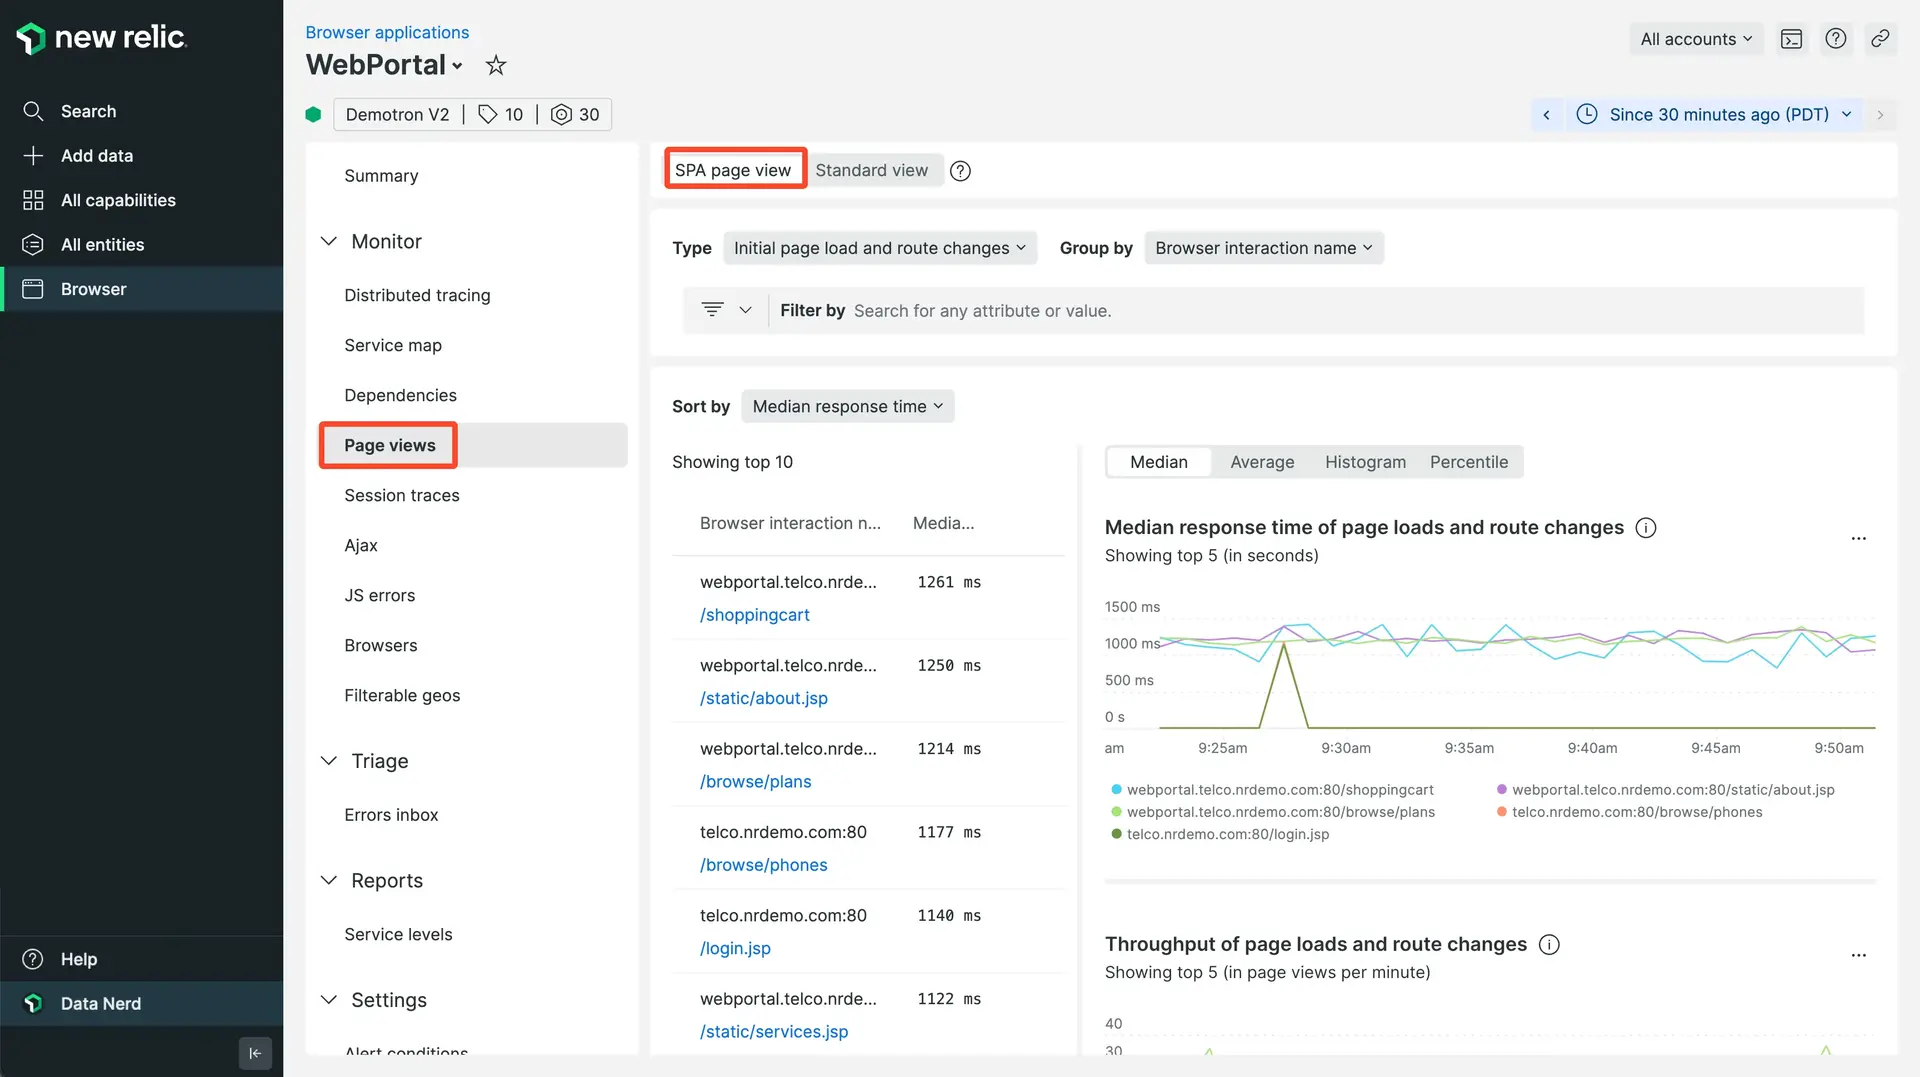
If you have opted in to SPA (single-page app) monitoring, the browser Page views page will include data on SPA route changes and initial page loads.

one.newrelic.com > All capabilities > Browser > (select an app) > Page views: When you opt in to SPA monitoring, the browser Page views page will display SPA data like route changes and associated asynchronous browser activity.
Single-page app (SPA) data
To view SPA data: Go to one.newrelic.com > All capabilities > Browser > (select an app) > Page views.
Initial page loads and route changes are automatically grouped by browser interaction name. You can adjust this with your allow list settings for segments.
If you set custom route names with the SPA API, the custom route names will be displayed. You can change how the page loads and route changes are grouped by using the Group page by dropdown.
By default, the list of page loads and route changes displays the most time consuming views at the top of the list. You can also sort by average response time, median response time, and throughput per minute by using the Sort by dropdown.
To search for specific views by grouped URL, type in the search bar below the Sort by dropdown. For example, to find URLs that represent your checkout page, search for checkout.
The charts on the initial Page view page display:
- The five views with the slowest average response times
- The five views with the highest throughput
To change the range of time being examined, use the time picker near the top of the page. (If you choose a time range more than eight days in the past, some filtering and grouping functionality won't be available.)
Filter SPA views

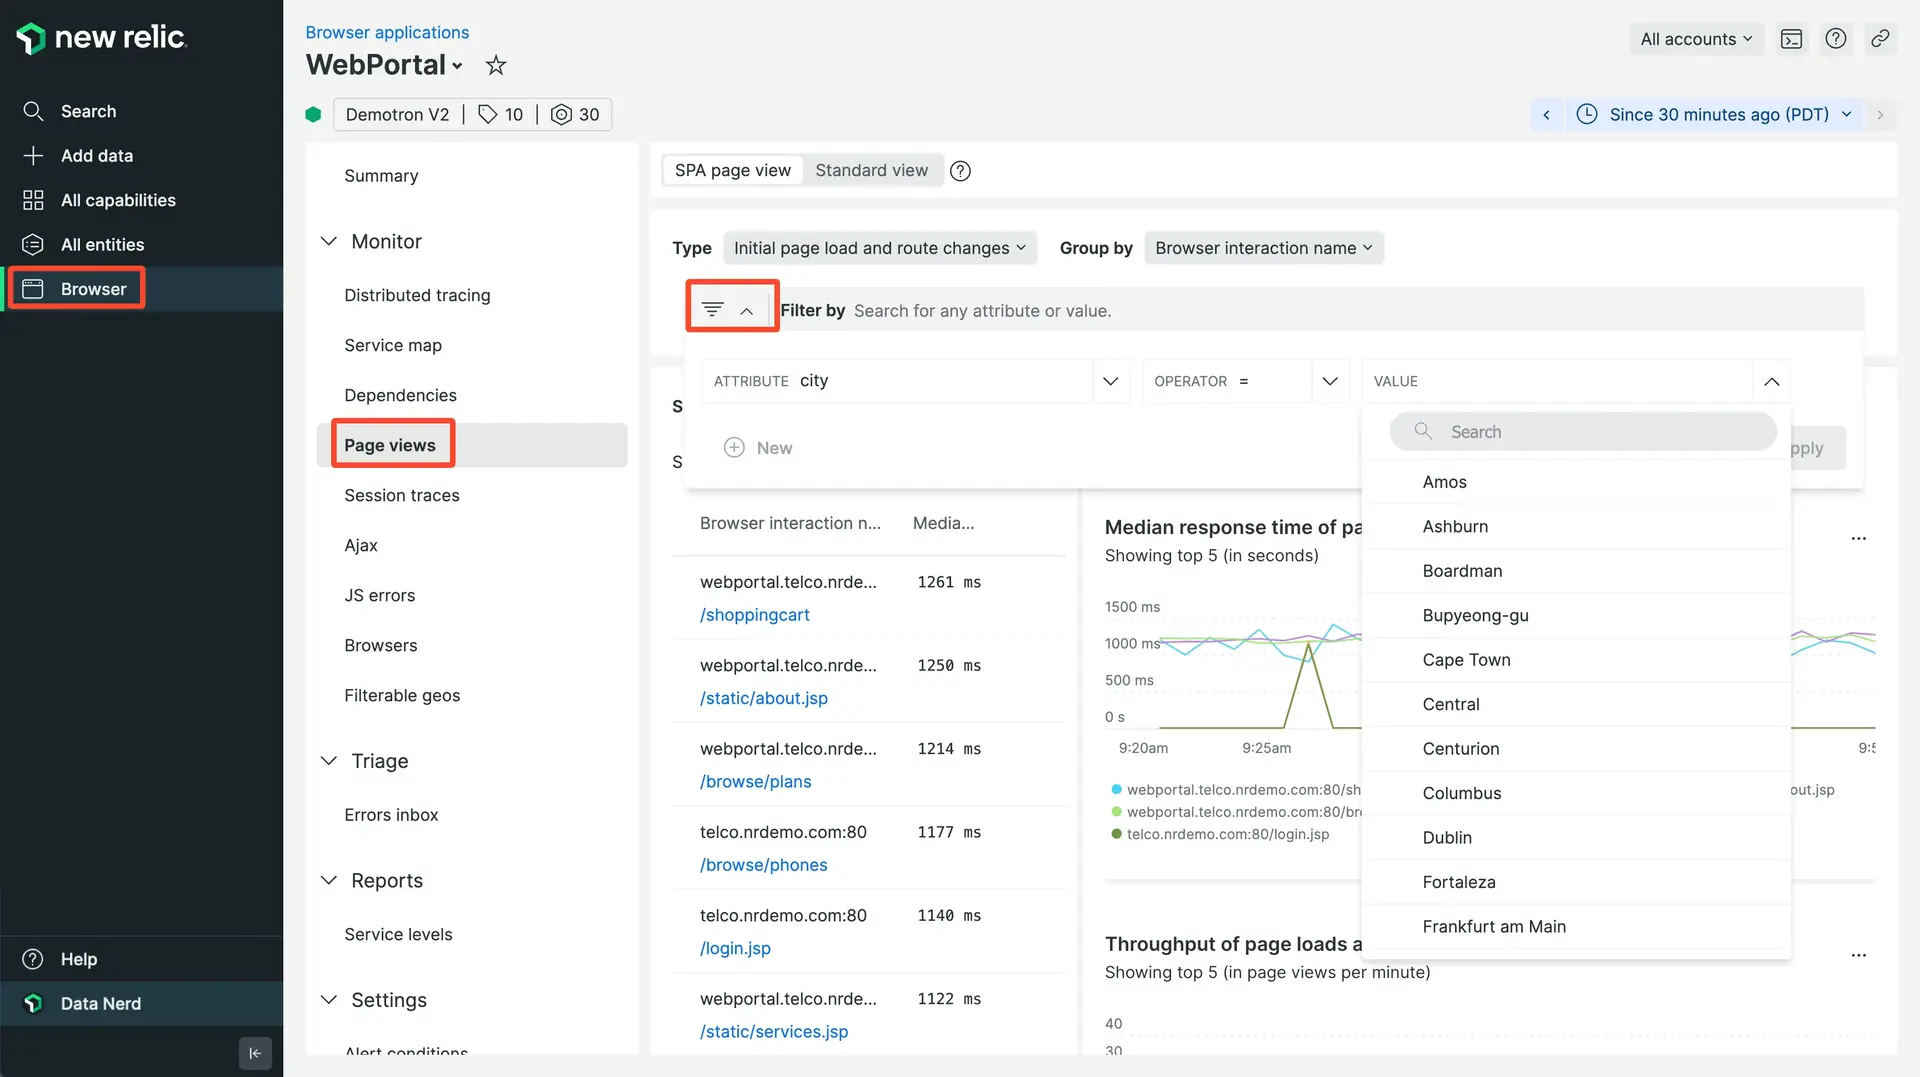
one.newrelic.com > All capabilities > Browser > (select an app) > Page views > Filter: Use the Filter to filter for route changes, initial page loads, and other attributes like location and browser type.
To view only initial page loads or only route changes, use the Filter dropdown. For example, to view only route changes, select Filter > Route change.
The filter also gives you the ability to filter by other attributes of page loads and route changes, such as app name, geographical location of the browser, and browser type. For example, to see only page loads and route changes that occurred on browsers in the city of Portland, Oregon, select Filter > City > Portland.
Group SPA views
You can use the Group page by dropdown to group the list of page views by any attribute. For example, if you want to compare the average response times by browser type, select Group page by > userAgent.
The combination of filtering and grouping lets you quickly find very specific data. For example, to compare how a specific URL is loading on different browsers:
- From the Filter dropdown, select targetURL, then select the URL you want to study.
- From the Group page by dropdown, select userAgent.
SPA view details

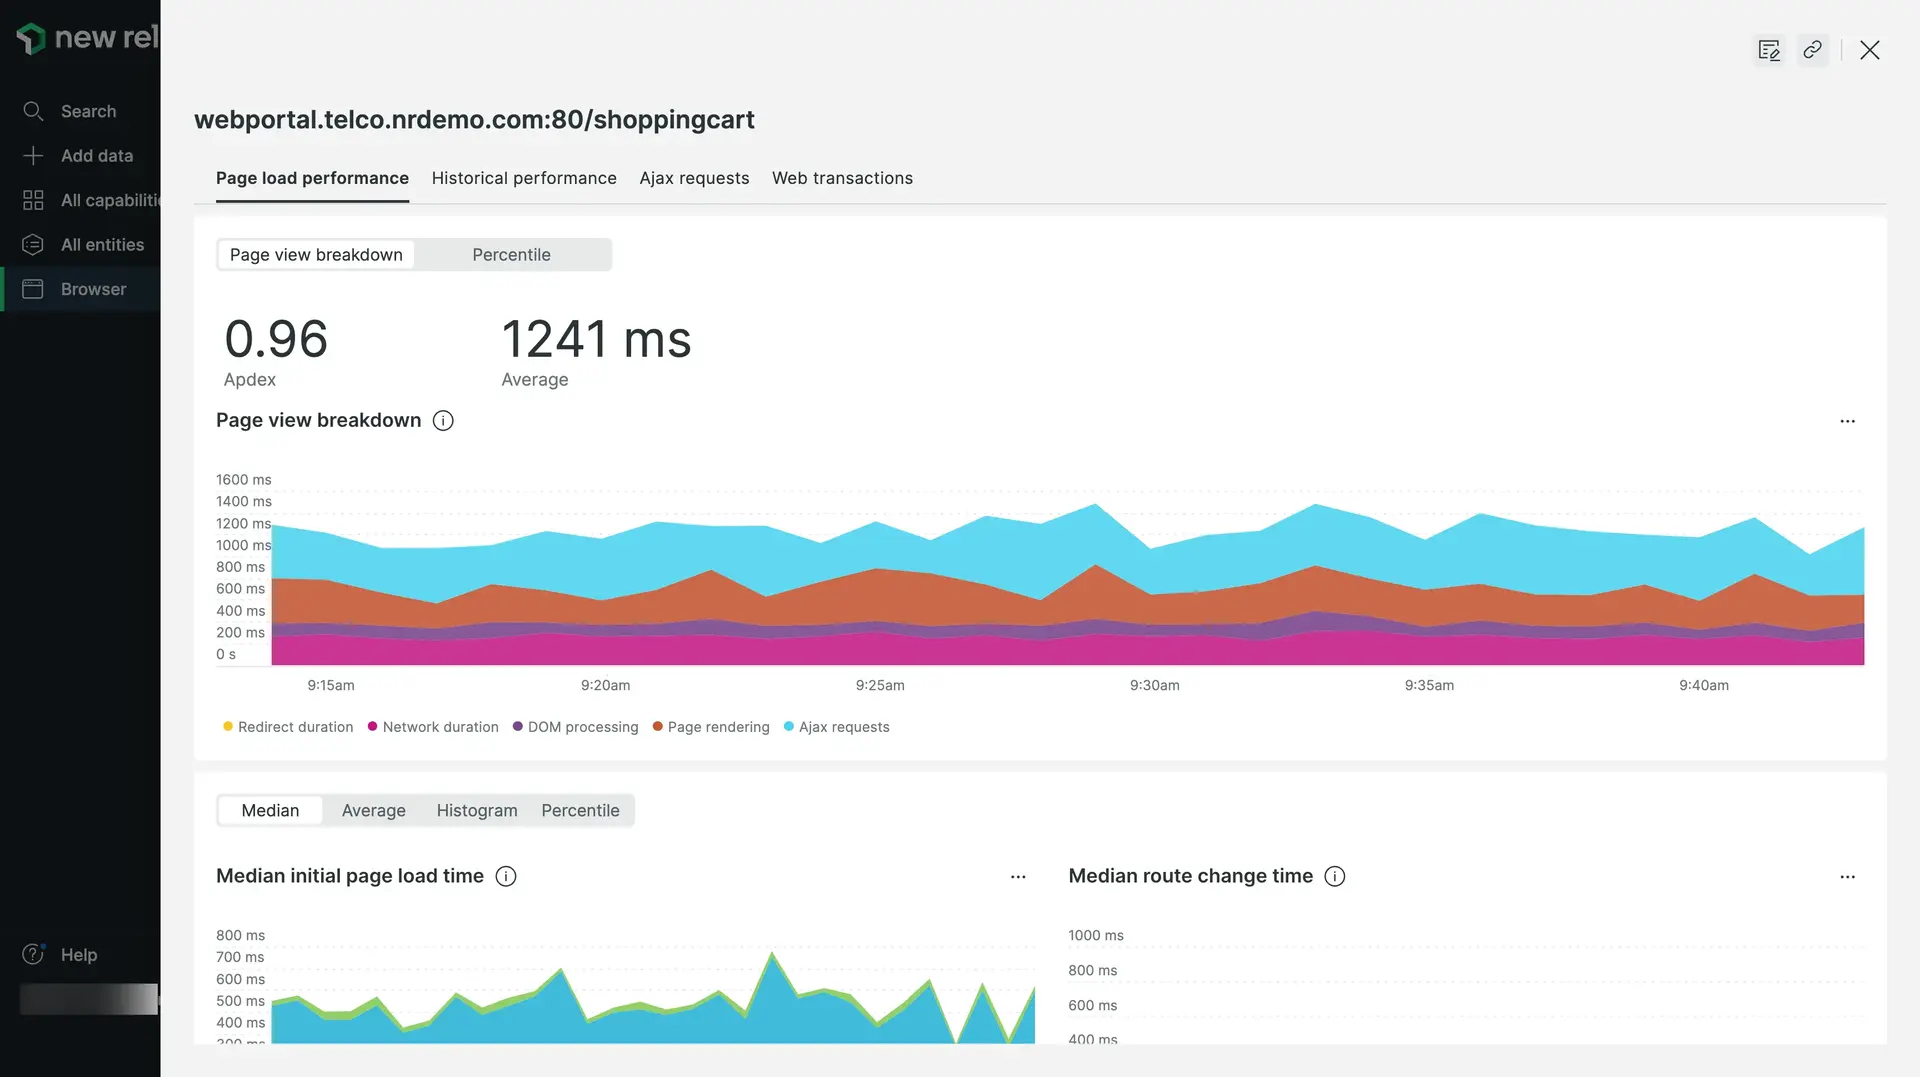
one.newrelic.com > All capabilities > Browser > (select an app) > Page views > (select a view): Select a view from the list to see assorted details and breakdowns.
Select an individual page load or route change to see details. Selecting either will provide a breakdown of where time was spent for a browser interaction, and display that data over a time series matching the window selected in the time picker.
Every route change view can theoretically also be an initial page load. (For example, when a route change URL is sent to someone else and they load it, that will now be considered an initial page load to New Relic.) This is why the SPA view details page has charts for both initial page loads and route changes. This allows you to compare how a view performs as an initial page load to how its performance as a route change.
There are three chart display options, selectable with the icons to the right of the Avg initial page load time chart title. The default display is the color-coded stacked area chart. You can also switch to a Histogram display or a percentile line graph.
Also on the details page is a Throughput chart that combines initial page loads and route changes. The chart displays the 5 pages with the highest throughput, which are listed beneath the chart, and consolidates all other pages into Other.
Here are details on the specific performance data displayed for both page loads and route changes:
The Historical performance and Breakdown details are similar for both page loads and route changes:
Detail tab | Comments |
|---|---|
Historical data | The Historical performance tab displays throughput (views per minute) and response time charted against the same time period yesterday and last week. |
Breakdowns | The Breakdowns tab lists the various components individually timed as part of an interaction. XHRs that started within the span of a |