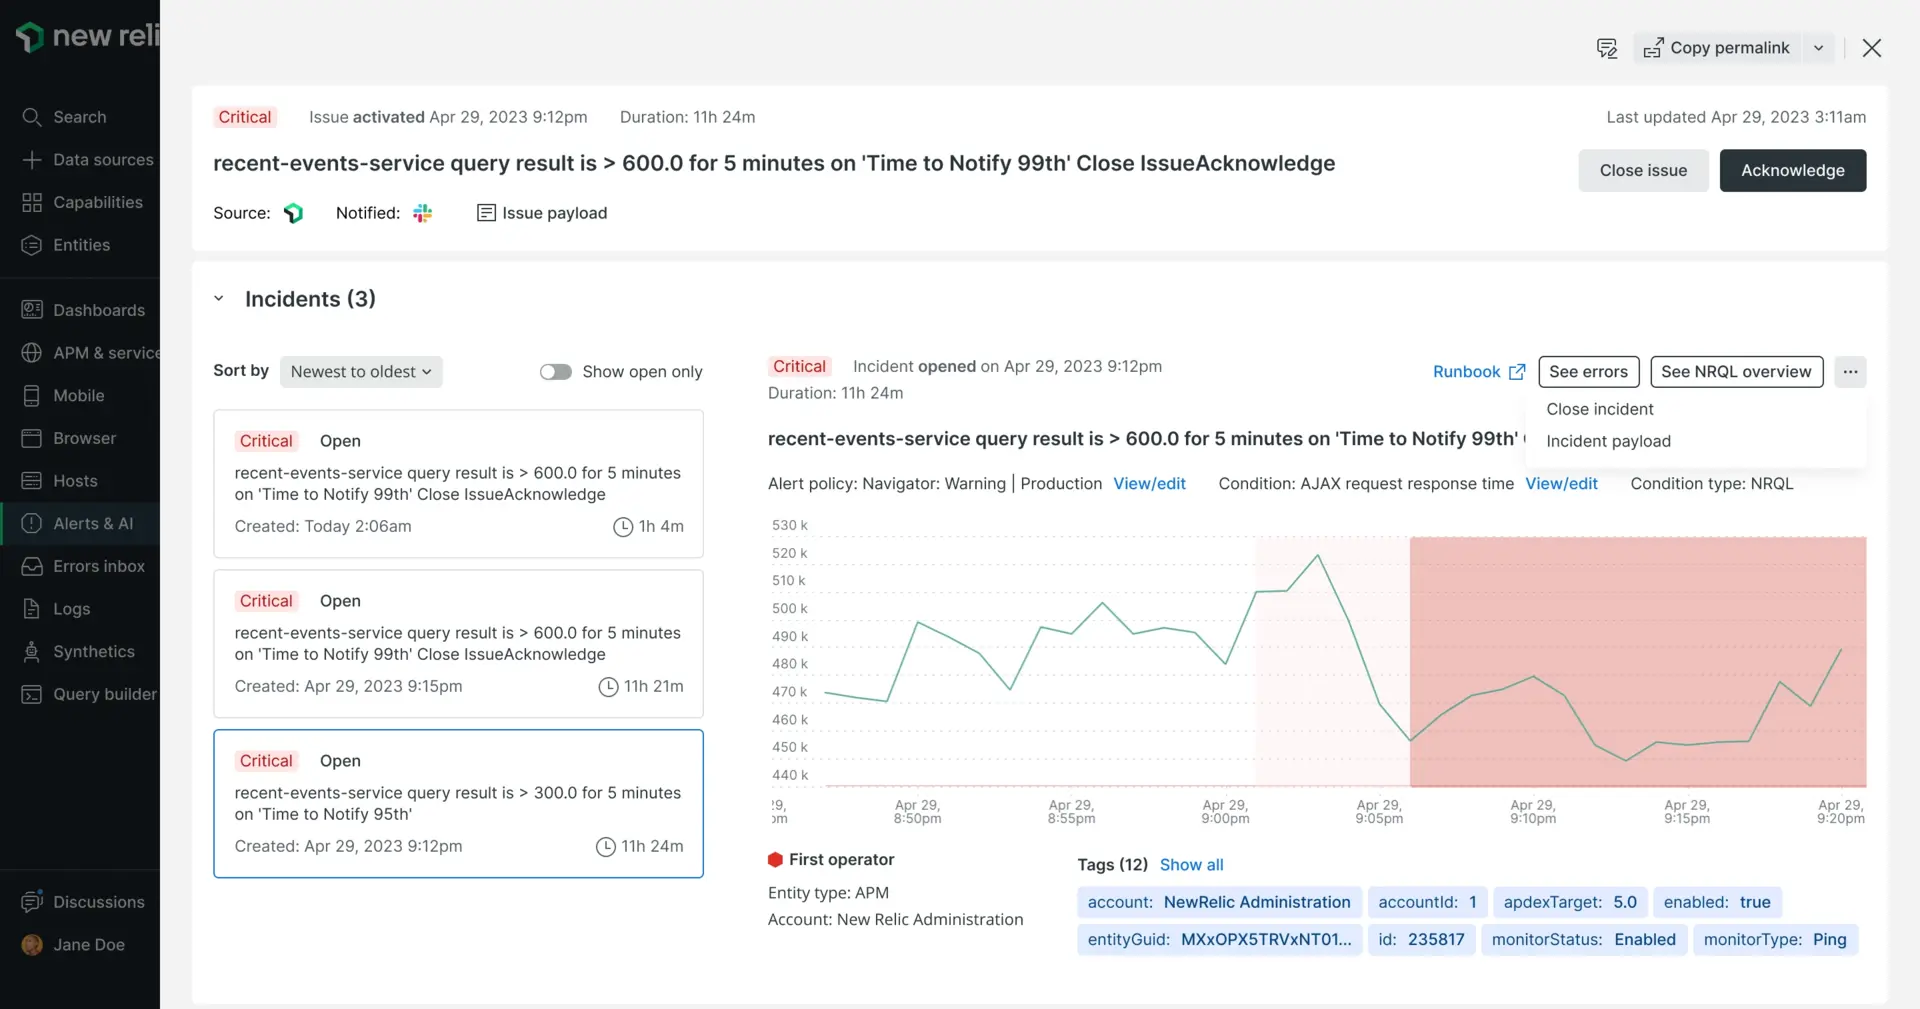
The Issues feed page is where you can find an overview of all your issues, along with helpful information about them. You can also click any individual issue for more detail, including its analysis summary, event log, and details about correlated issues.
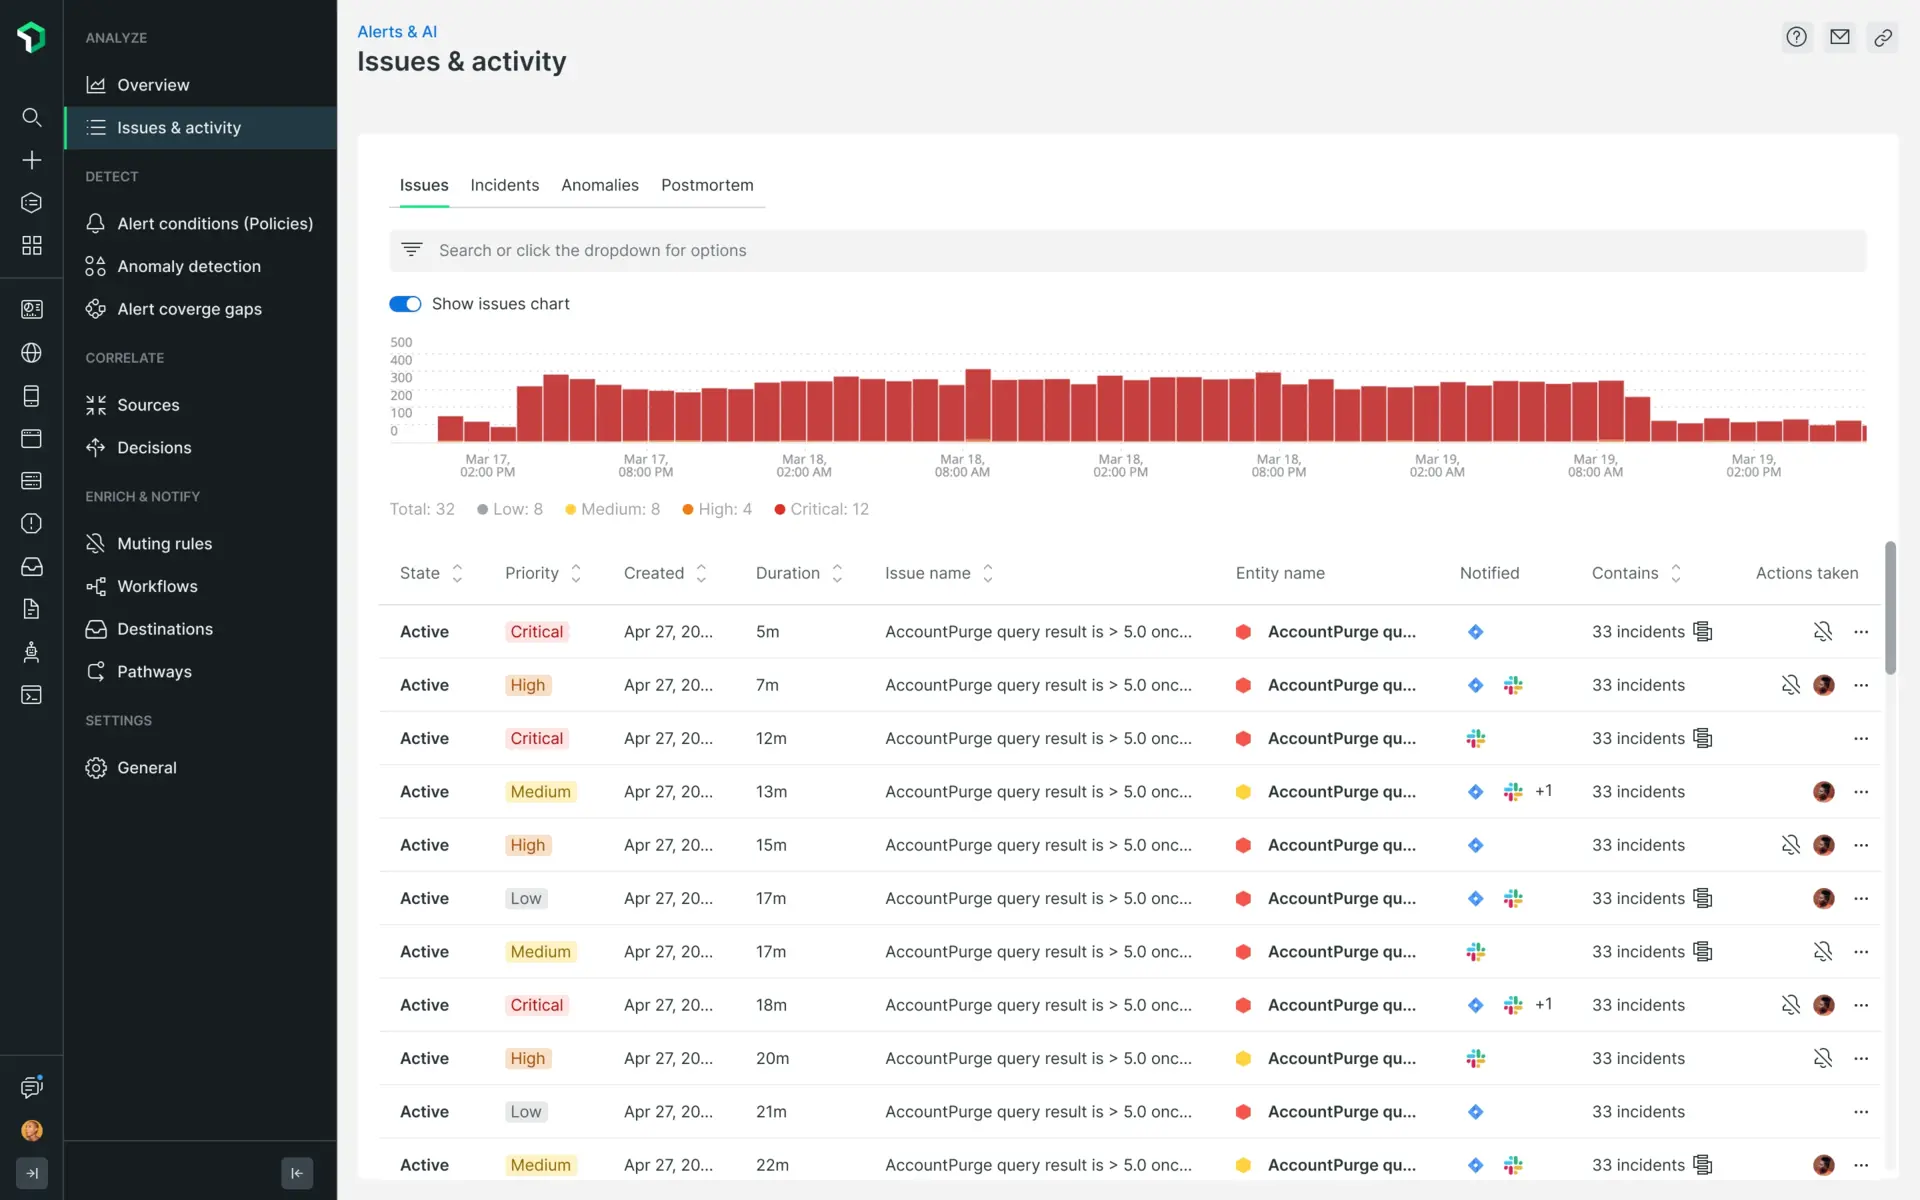
Go to one.newrelic.com > All capabilities > Alerts > Issues & activity. This screenshot shows an example issues feed, which describes your issues' statuses, correlations, and more.
Search and filter issues
You can easily search for any issue by using the search bar free text. This search bar enables you to search by:
- Issue name
- Issue ID
- Policy Name
- Condition Name
- Entity name
- Entity ID
- Priority
Bulk actions
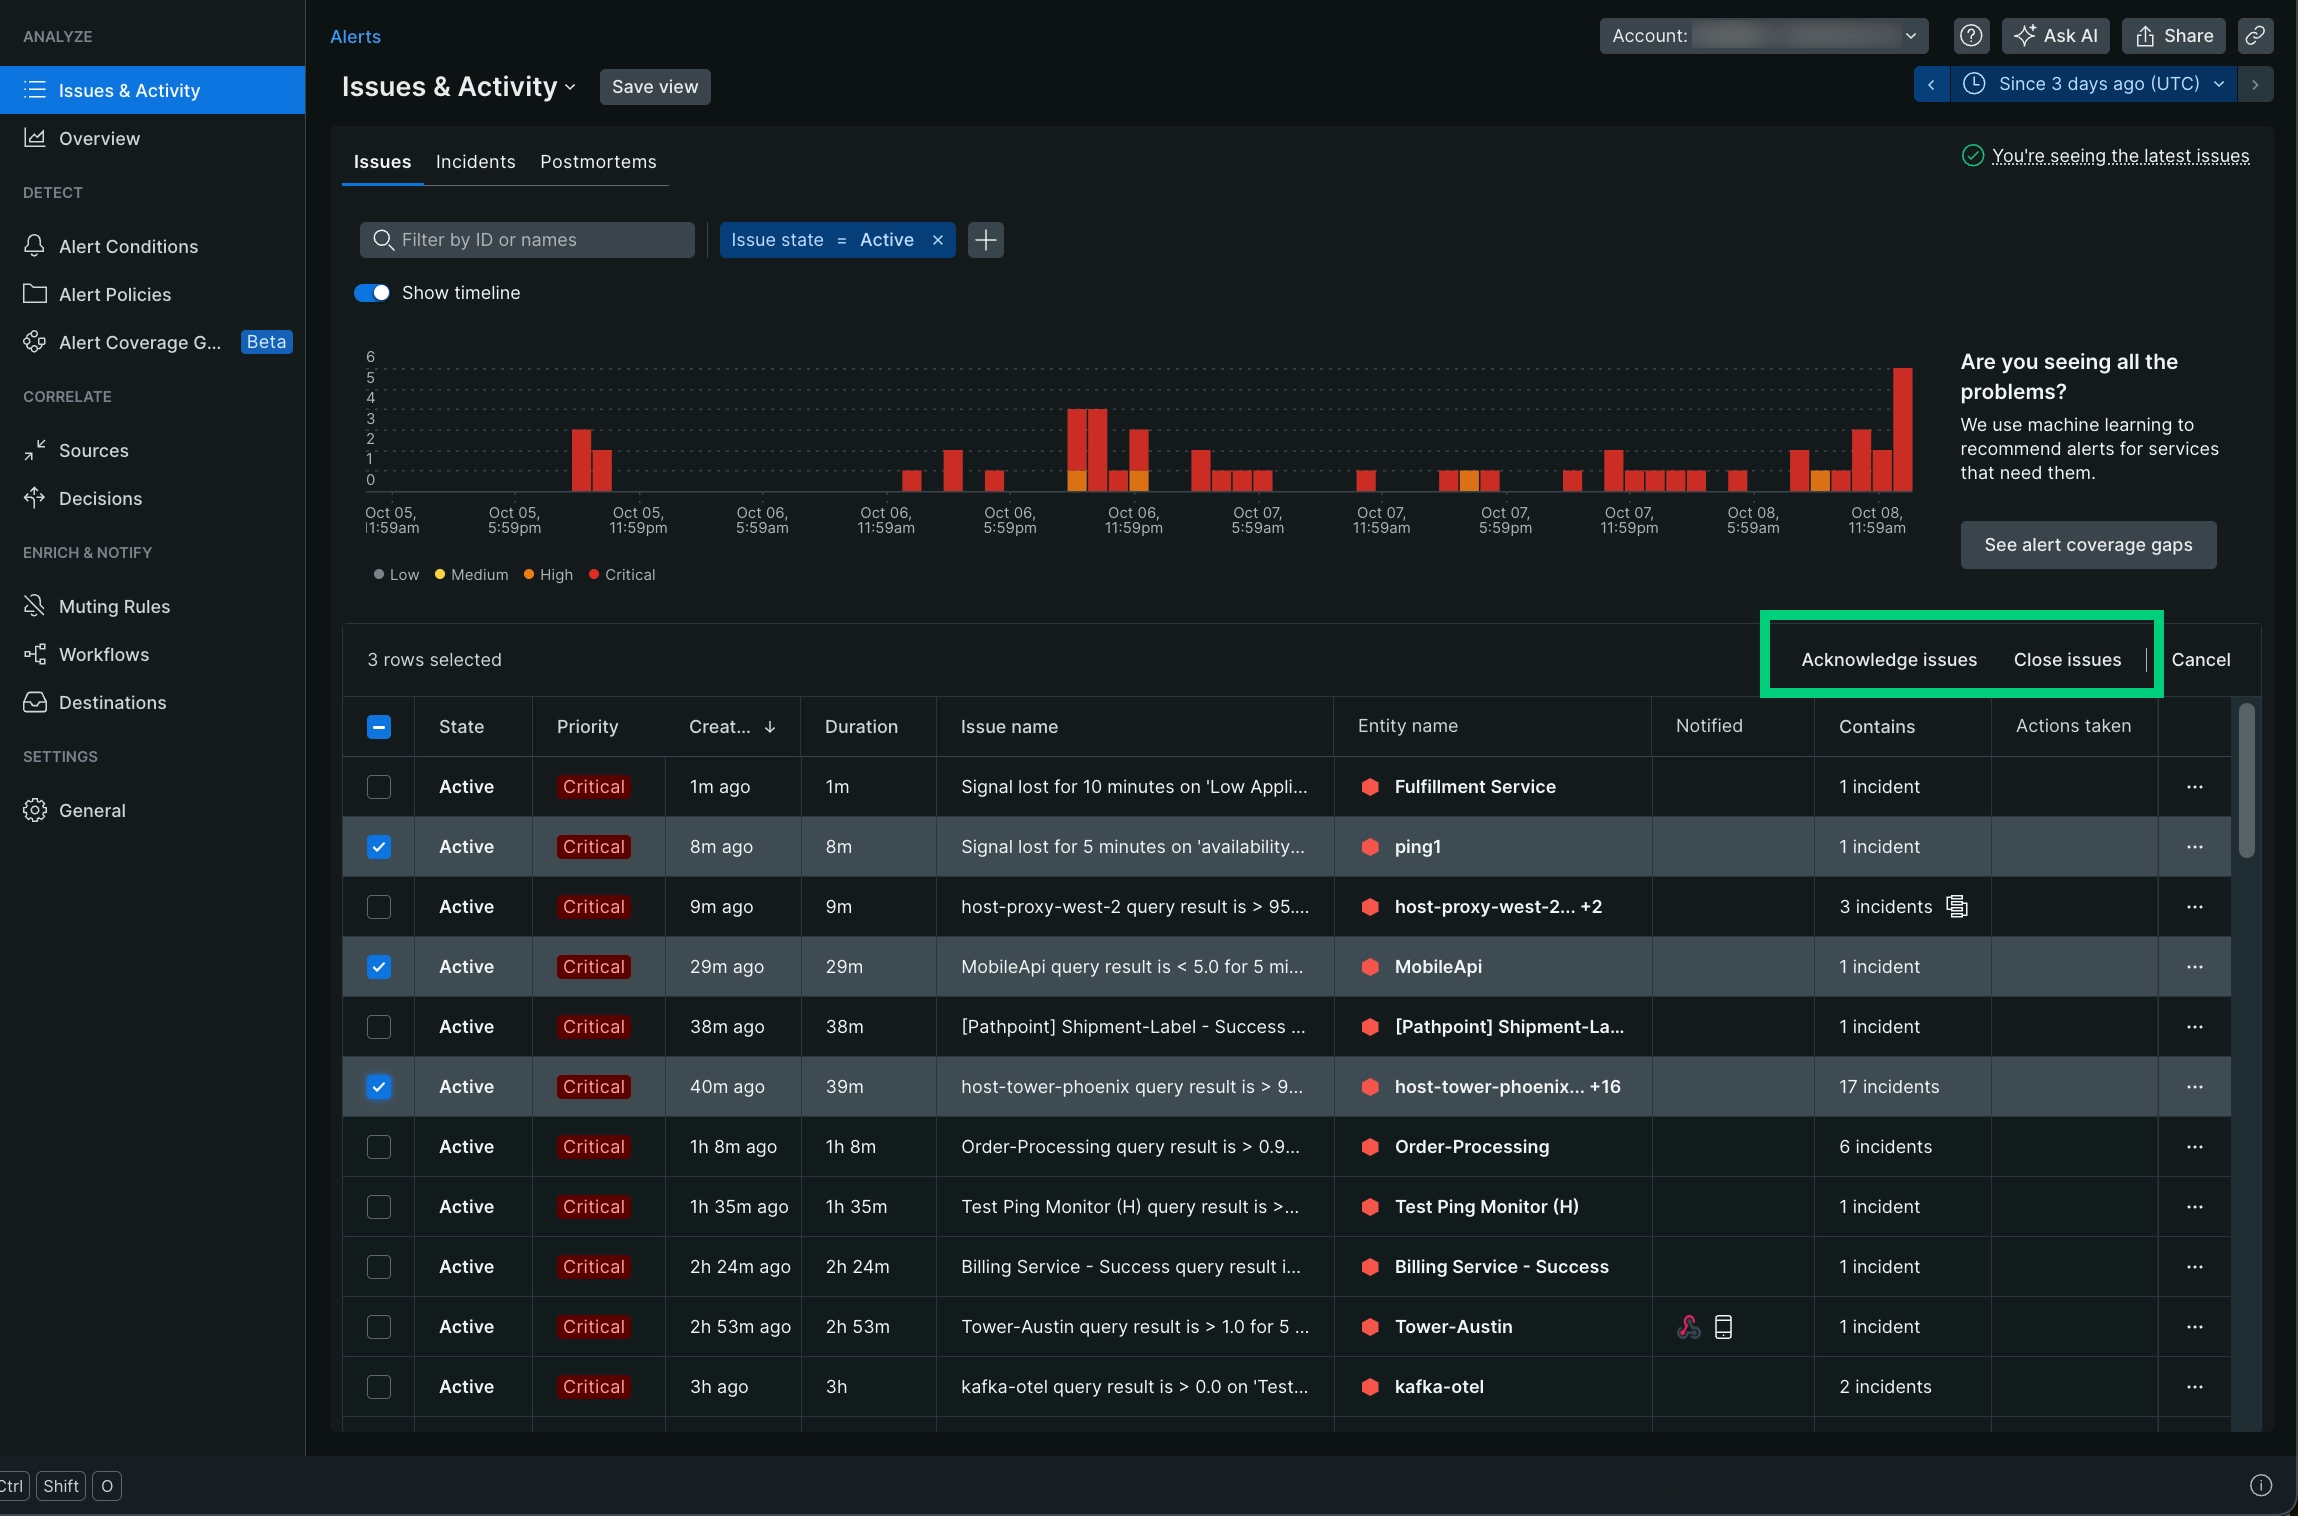
You can acknowledge or close multiple issues directly from the issue fees list by selecting them and choosing either the Acknowledge issues or Close issues actions.
重要
Alert conditions currently support two priority levels: warning and critical. These levels determine the priority of the incidents they generate.
A warning threshold on an alert condition creates a high priority incident.
A critical threshold creates a critical priority incident.
An issue's priority is derived from the highest priority of its constituent incidents. For example, an issue with 4 high / warning incidents and 1 critical incident would be assigned a critical priority.
If you click the filter icon, you can filter by any issue attributes or any related tag:
- Issue state (created, active, or closed)
- Issue acknowledged(true or false)
- Issue muted (true or false)
- Issue correlated (true or false)
- Issue priority (low, medium, high, or critical)
- Issue source (NR alerts, NR anomalies, or REST API)
- Entity
- Alert policy
- Alert condition
- Tags (search for any tag related to the issue)
You can also use the feed sorting option to find what you're looking for faster, for example, sort by issue duration or created time.
Issue page
The Issue page provides you with bottom-line insights so you can first understand the problem, and then minimize the time to resolve.
We've created a quick demo here to walk you through the issue page user interface:
About Issue page
Postmortem
A postmortem is a retrospective process that teams use to analyze what worked and what didn't when responding to and resolving an incident.
In the New Relic platform, the postmortem feature is a tool that automatically collects data related to an incident, freeing up your team to focus on analysis and action items for improved responses to future incidents.
The postmortem includes:
- The record of an incident, including descriptions
- A timeline of the incident
- The incident's impact
- The incident's root causes
- Mitigation measures taken by your team
- Follow-up action items to prevent the incident from recurring in the future
For detailed steps on creating a postmortem or to watch our walk-through demo, visit our Postmortem documentation page.
Impacted entities and issue map

Mouse over an entity to see more information about it.
In the Impacted entities section, an issue map is available for any issue involving two or more entities. The map shows not only the affected entities, but also the services and resources directly related to those entities.
Impacted entities: An entity is anything that has data you can monitor. Specifically, these are focused on incidents from New Relic sources, extracting the entities and providing a summary. Each entity is unique. You can see your entities in a list or on a map.
Depending on the data in an issue, all four of these sections can show up together for each issue or separately. All you've to do is click on the 3 dots next to the entity to open the dropdown menu with options as follow:
- See dashboards helps users in your account look at and interact with dashboards you've created that are related to an entity. The queries you've run to power the various widgets are automatically mapped to entities whenever possible and are presented back to you here for quick access and discovery.
- Entity view will open the application's anomalies page. This is only available for applications that are set up for proactive detection.
- There are two types of deployment events: deployments and related deployments. Click Show all deployments to see all your deployment events when they arrive, or click a specific deployment to see its deployments page. The APM deployment page lists recent deployments and their impact on your end user and app server's Apdex scores, response times, throughput, and errors. This section will only show up if New Relic has identified applications under the impacted entities that have deployments.
Issue timeline and Log
The issue timeline, as presented below, shows you a breakdown of:
- Incidents
- The trends taking place
- What incidents are active
- What incidents are resolved
- What is correlated to each other
- Various milestones at different issue levels

If you're interested in viewing the issue logs, you can simply toggle to the issue log button where you'll be able to view the timestamp and notification details. You can also click on "show more" to see the full issue log.

In addition, you'll see a grey line at the top of the timeline. In comparison to the visual timeline that shows the changes to each incident, the grey line represents changes to the issue.
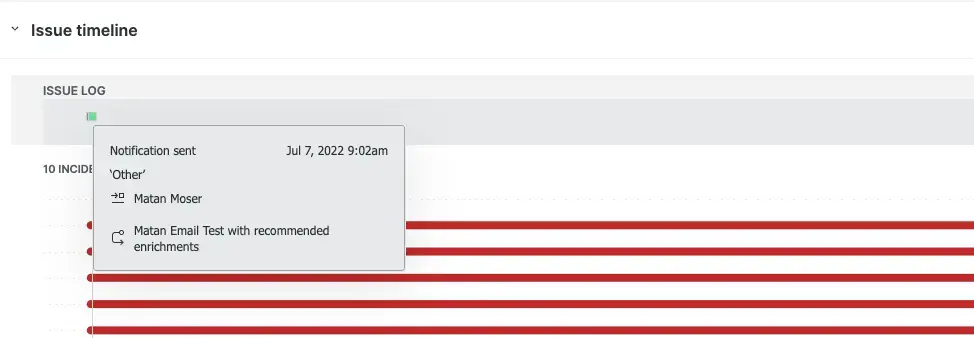
Mouse over the grey line to see details of the event.
Finally, mouse over the incident to see information on the location, timing, and level of importance of a specific incident.
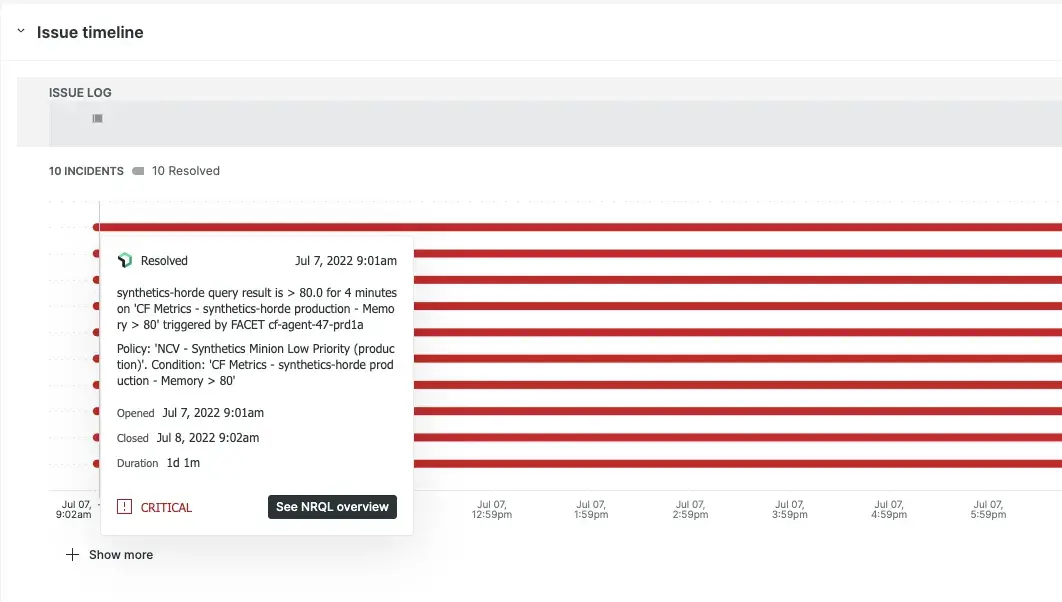
This figure shows a particular incident populated on January 11th with a level of Critical.
To view the issues in a text format, in the right hand corner, click Switch to issue log view.
Use decisions
To further reduce noise or get improved incident correlation, you can change or customize your decisions. Decisions determine how incidents are grouped together.
To get started, refer to Decisions.
