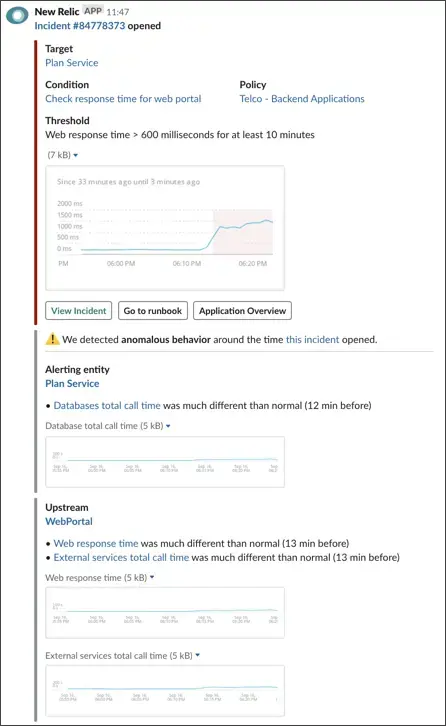
When the threshold set in a condition is exceeded, depending on the policy's Alert event preference settings, may create an alert event. You can review information about alert events in several ways:
- View the alert events index so you can scan for patterns in a list of alert events.
- View the alert events log to examine associated performance details.
- View the events included in a specific alert event to review the timestamps for events, such as an alert event opening or closing, notifications, and acknowledgements.
View the alert events index and alert event details
Alert events are grouped together into alert events. If you want to change how alert events are grouped, open the associated policy and change the Alert event preference setting.
To view alert event details:
Go to one.newrelic.com > Alerts and click the Alert events tab.
Select one of the alert events in the table to open its details.
Details for individual alert event charts include:
Timing information: The shaded red area on the chart shows you the time period when the alert event occurred, where the preceding shaded pink area represents the degradation period. If you select an alert event that lasted longer than two hours, the timeline on the bottom of the chart will be jagged. To provide context for events in the alert event, the chart also shows the time frame surrounding the alert event.
Chart guidelines: The red dotted line marks the threshold for the condition. The blue line depicts performance information.
Anomalous behavior: If alerts detects anomalous behavior near the time of the alert event, you'll see a notification in the alert event details.
From this page, you can take action regarding the alert event:
If you want to... | Do this |
|---|---|
Assume responsibility for the alert event | Acknowledge the alert event. There are 2 options:
|
View information about events | Mouse over any spot on the blue line in the chart to display event information. |
Manually close the alert event | Below the chart, select the Manually close alert event link. ConseilAnyone in the account who can view the alert event can also close it. |
Edit the policy or condition | Select the Settings gear icon or select the name of the policy above the chart. |
View the events in an alert event
If you want to view alerting events across all products, go to one.newrelic.com, then click All entities. To view the events for just one alert event:
- Go to one.newrelic.com > All capabilities > All entities.
- Select an entity row.
- In the left nav under Events, click Issues & activity.
- Select one of the events to view a chart and details for it.
Time between an alert event and the notification
There may be a difference of up to three minutes between the alert event event time and the initial notification time due to variances in data processing time.
- Notification time: The time in the notification reflects the timestamp of when we received the request to deliver a notification.
- Alert event time: The time you see on the Events page for the alert event reflects the timestamp of data collection for the last data point that contributed to opening the alert event.
Anomalous behavior detection
When we detect large changes in key signals in the alerting entity and/or upstream/downstream applications of the alerting entity, an "anomalous behavior detected" notification appears on the alert event's page and in notification channels. You can:
- Expand the notification for details about the detected anomaly (web only).
- See upstream/downstream anomalies (Slack only).
- Select a link to go to the relevant product chart for further investigation.
