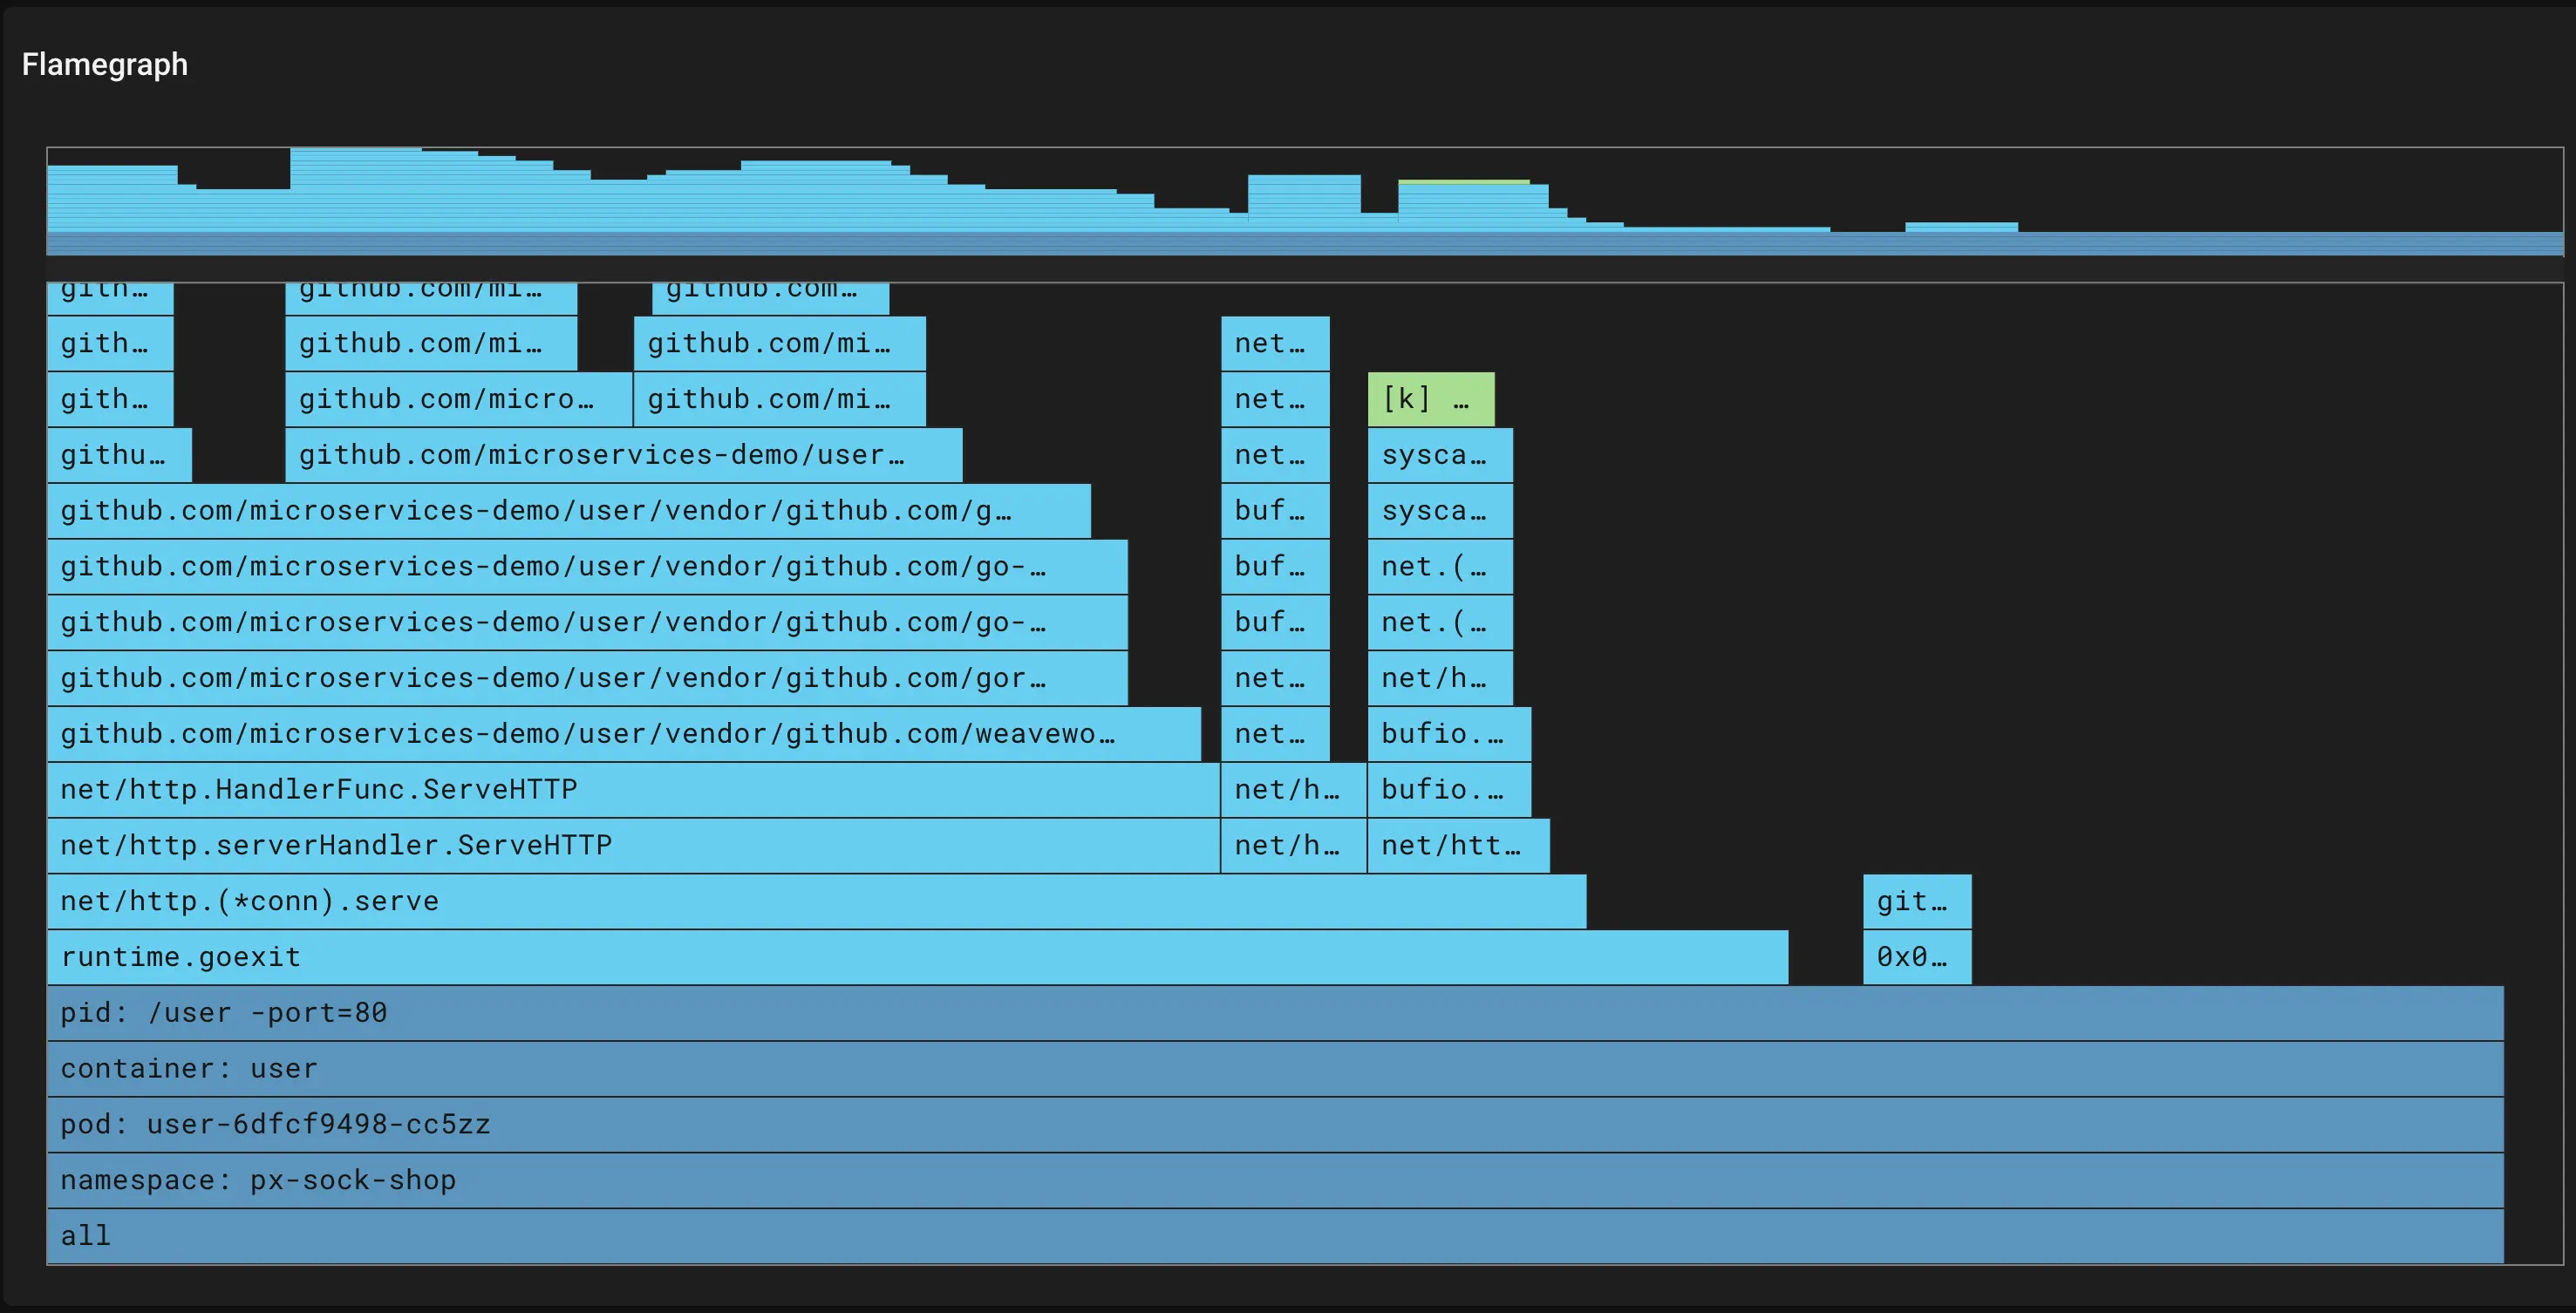
Optimize your Java code by understanding CPU utilization using flamegraphs
- Understand where your Java application is spending its CPU time and why CPU utilization increased with your new release.
- Use continuously in production with a minimally-invasive, ultra low overhead (< 0.1%) profiler.
- Avoid downtime with no need to re-deploy your application.
- Get full system visibility, including for both Java and all other running applications.
Note: Pixie's continuous profiler also supports Go, C++, and Rust.
How to get started
- Deploy Pixie in your cluster(s).
- In the New Relic UI, select a pod listed in the Kubernetes cluster explorer view to see the pod details view.
- From the pod details view, select the Check flamegraph in Pixie option.
- Alternatively, use the px/node script in the Live debugging with Pixie tab. Scroll to the bottom of this view to see the CPU flamegraph for the node.
Learn more and check out a deep-dive video on the Pixie docs page.
