When your system is fully instrumented, you can correlate data between your system infrastructure and the apps your infrastructure supports. It's likely, though, that you have thousands of faceless hosts allocating resources to various apps. You may not have the full context of what is happening where, which makes finding relevant data overwhelming. How do you sort through all of your data to find infrastructure-related causes to failing apps?
Objectives
This doc guides you through finding relevant data within the infrastructure UI. You will:
- Filter your infrastructure data by attributes
- Identify specific hosts and apps without additional context
- Use the timepicker to find when a change occurred
Explore your host data to find the cause of an outage
Identify failing hosts
If you're uncertain about how to get started, we recommend initially scoping your hosts by alert severity. Using the summary page overview, you can see that there are three critical alert events happening in your system.
You can use the filter bar to view data only about those three critical alerts. In this case, your query would read alertSeverity = 'CRITICAL', which scopes your aggregated data from 83 hosts down to three.
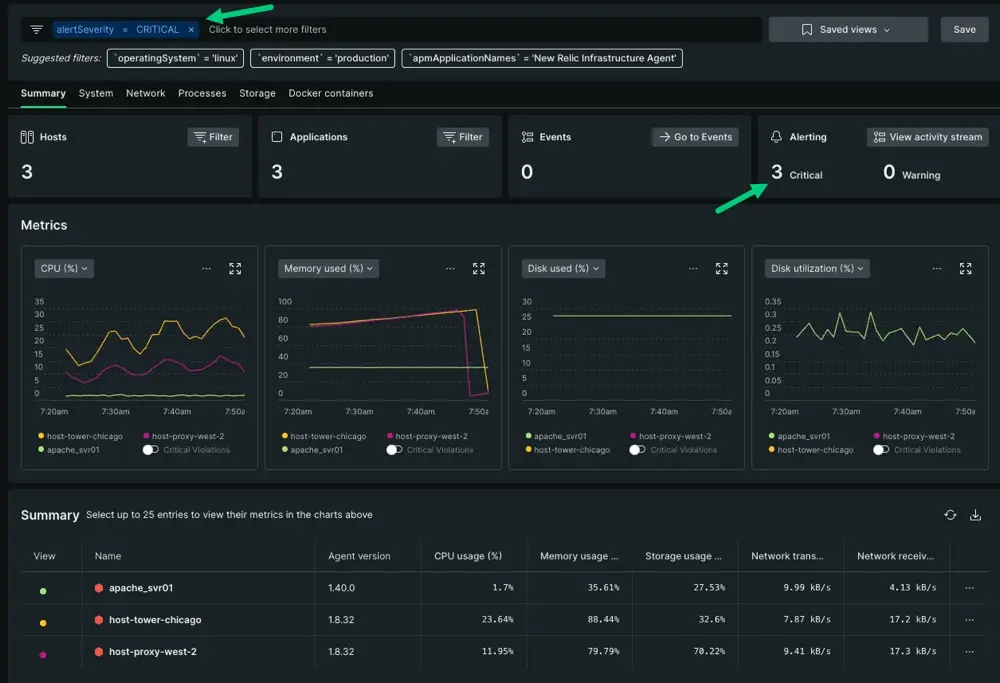
If you haven't set up yet, you can always sort the summary table by hosts metrics. For example, let's say that you have no indication that hosts are failing but you've still been notified about a problem.

- Click the name column on the summary table. You can sort by ascending or descending order.
- In the screenshot, we sorted hosts by CPU usage, which placed
host-tower-portlandat the top with 99.84% CPU. - Repeat the same process for memory usage, storage usage, and so on if needed. Repeat until you've found a pattern for anomolous behavior.
- When you have time, consider creating alerts for any critical thresholds.
Filter by app name
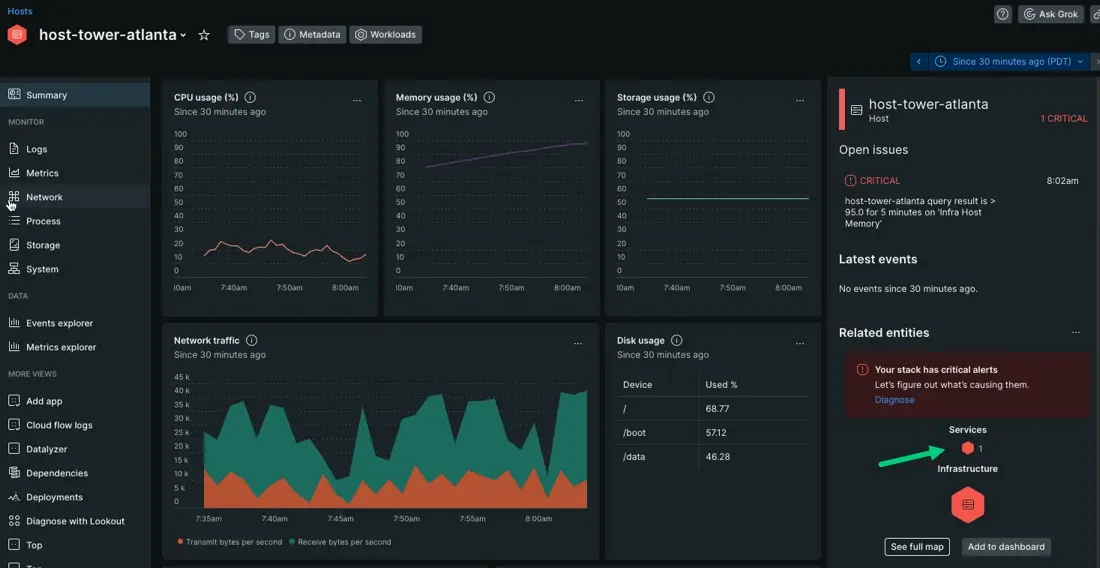
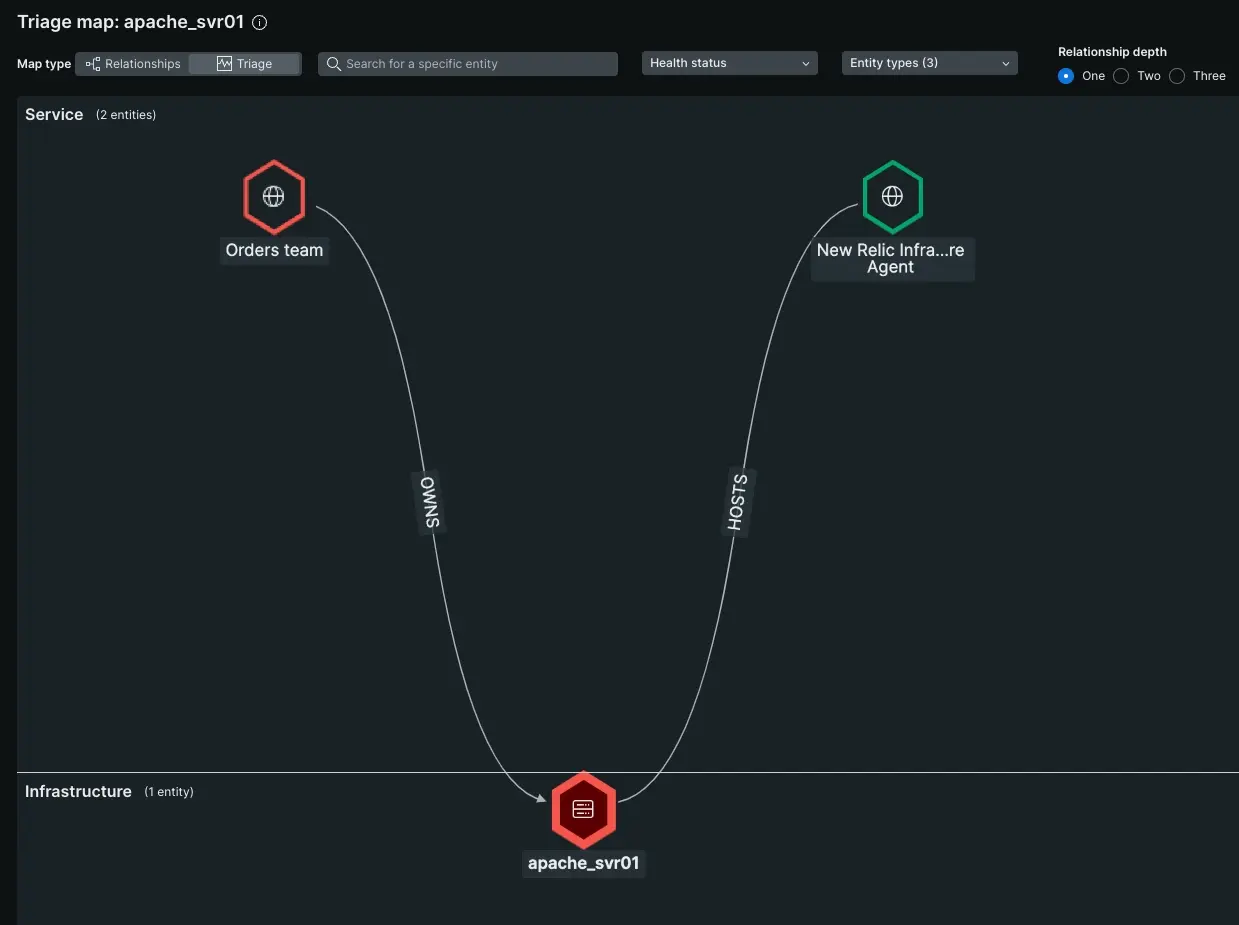
Once you've identified a host related to the alert event, you can click through to view data only about that host. In this scenario, we've chosen apache-svr01. Since we're trying to solve an app-related issue, we're starting at the service map on the host's page. This map shows you what apps depend on your chosen host.
Return to the infrastructure summary page so you can update your query. We want to evaluate all hosts related to this app even if they're not yet alerting. Viewing the problem host in context of its partner set improves your understanding of what's causing the app failure. For instance, maybe the other hosts are approaching a threshold, or maybe you haven't created an alert for those others hosts.
Adjust the filter bar to show any hosts related to the Orders team app. Your query should now read apmApplicationNames = Orders team.
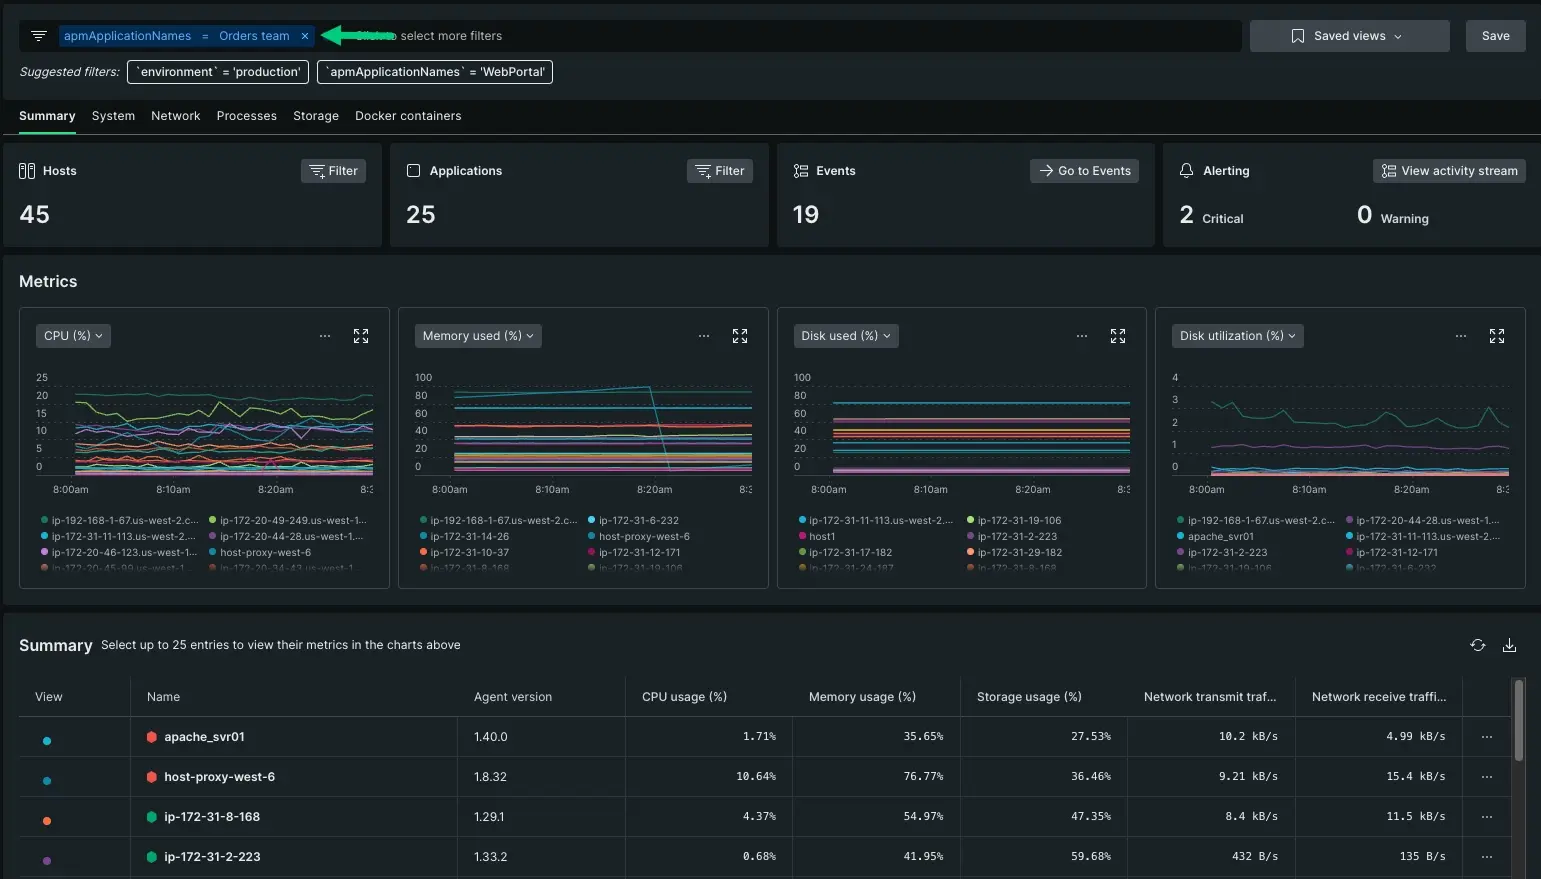
This filter widened the alert event radius beyond your initial apache_svr01 host, but still kept your data scoped to a relevant set. From here, you can start digging deeper into what resource limitation is affecting performance.
- Since only a couple of these hosts are alerting, you can rule out a potential database issue, which would affect all of the hosts.
- Instead you might choose to dig deeper in the System, Network, Processes, Storage, or Docker containers tabs. The next doc in this series covers how to compare and correlate data behavior.
Adjust the time picker to find when a change first occurred
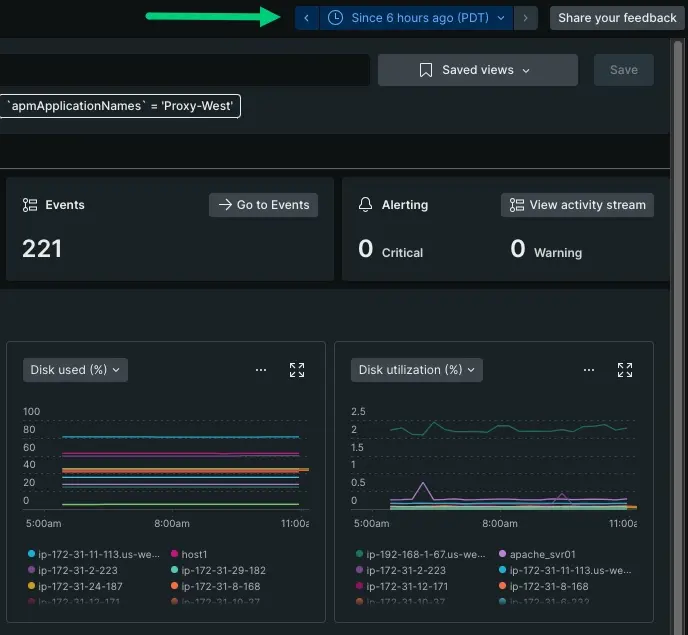
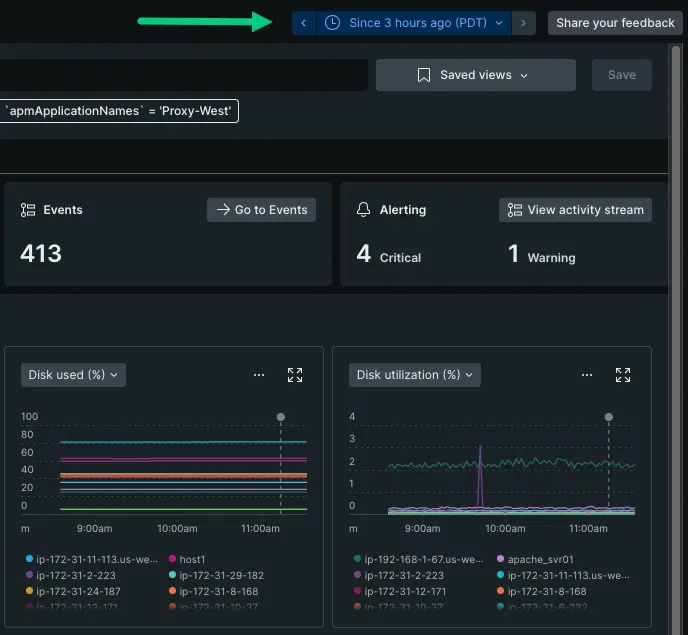
Adjusting the time picker lets you view how your data has changed over time. This action lets you track when a change first occurred. Let's look at these metrics graphs toggled between 3 hours ago and 6 hours ago.
Your time series at 6 hours doesn't display an obvious increase in disk utilization. Toggled to a 3 hour parameter, you can see approximately when behavior started to change. Your metrics graphs give you a visual clue when a spike or drop occurs.
If there's been an unexpected increase in load, the Events tile will display either many or too few expected events.
The Alerts tile displays the number of hosts that are currently alerting with critical or warning thresholds. A steady increase in alerts over time might indicate when a change escalated the alert event behavior.
The tiles and metrics graphs can help you triangulate the approximate time of an alert event. This is especially helpful if the cause of an alert event is due to a update from an external vendor, or a deployment from another team. If that is the case, your next step for digging deeper would change.
What's next?
We've introduced how to locate failing apps by evaluating your infrastructure data. By starting with the summary page, you can overview how your hosts are performing over time and identify which hosts are supporting failing apps.
But how do you use your infrastructure data to make a decision about resource allocation? The next doc covers how you can dig deeper on a more specific alert event, like troubleshooting high CPU.
