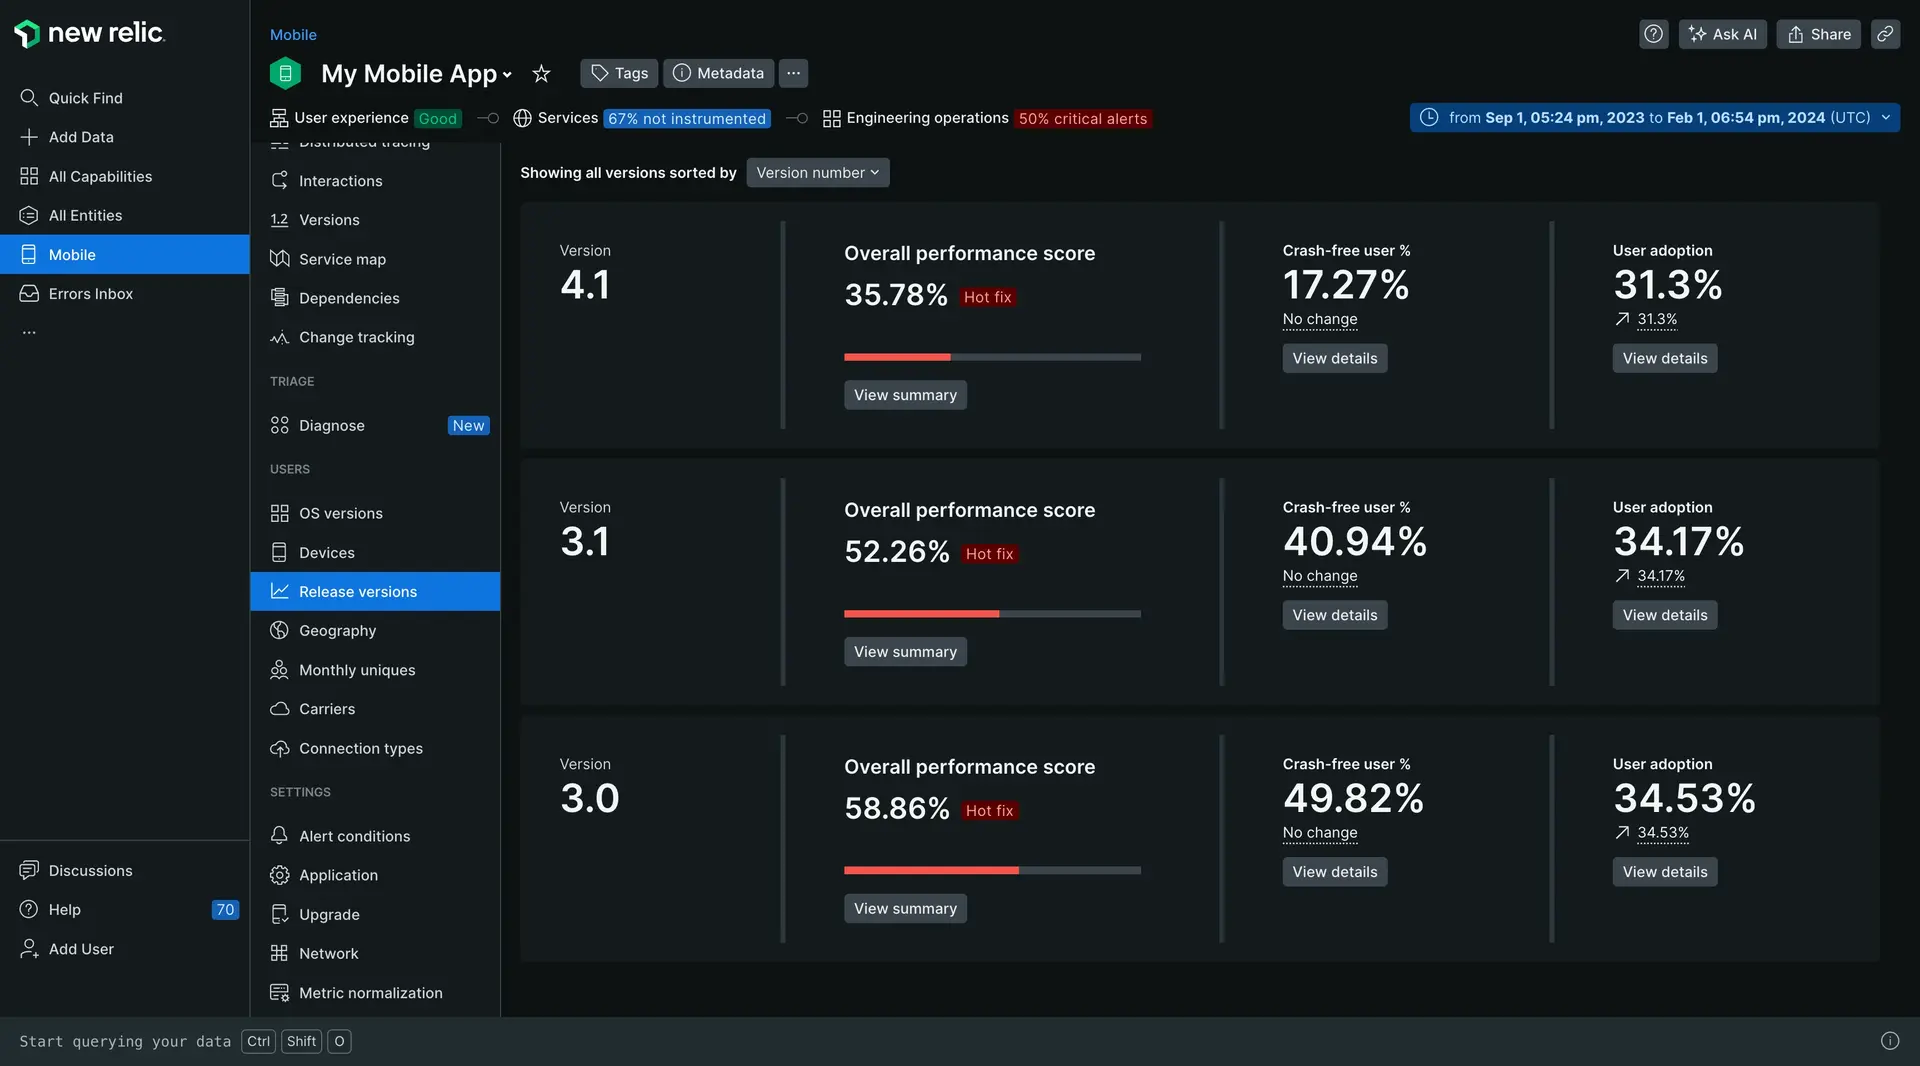
Curious about how your latest app launch is performing? Use our Release versions page to view crash rates, user engagement, and overall performance metrics between different release versions, which you can use to analyze the success of your latest release.

View the Release versions page
- Go to one.newrelic.com > All capabilities > Mobile.
- Select your mobile app.
- In the left-hand menu, click Release versions.
Sugerencia
Not seeing data? Try the following:
- Adjust the time filter to include data before a new version released.
- Make sure your mobile agent is using iOS agent version 7.0.0 and higher or Android agent version 6.5.0 and higher.
Drill down into specific metrics
The Release versions page displays high-level metrics on each app version:
- Overall performance score: Calculated by overall customer crash rate and HTTP error-free rates.
- Crash free user %: Percentage of users not experiencing crashes on a specific version.
- User adoption: Percentage of users who have updated to or installed a specific version.
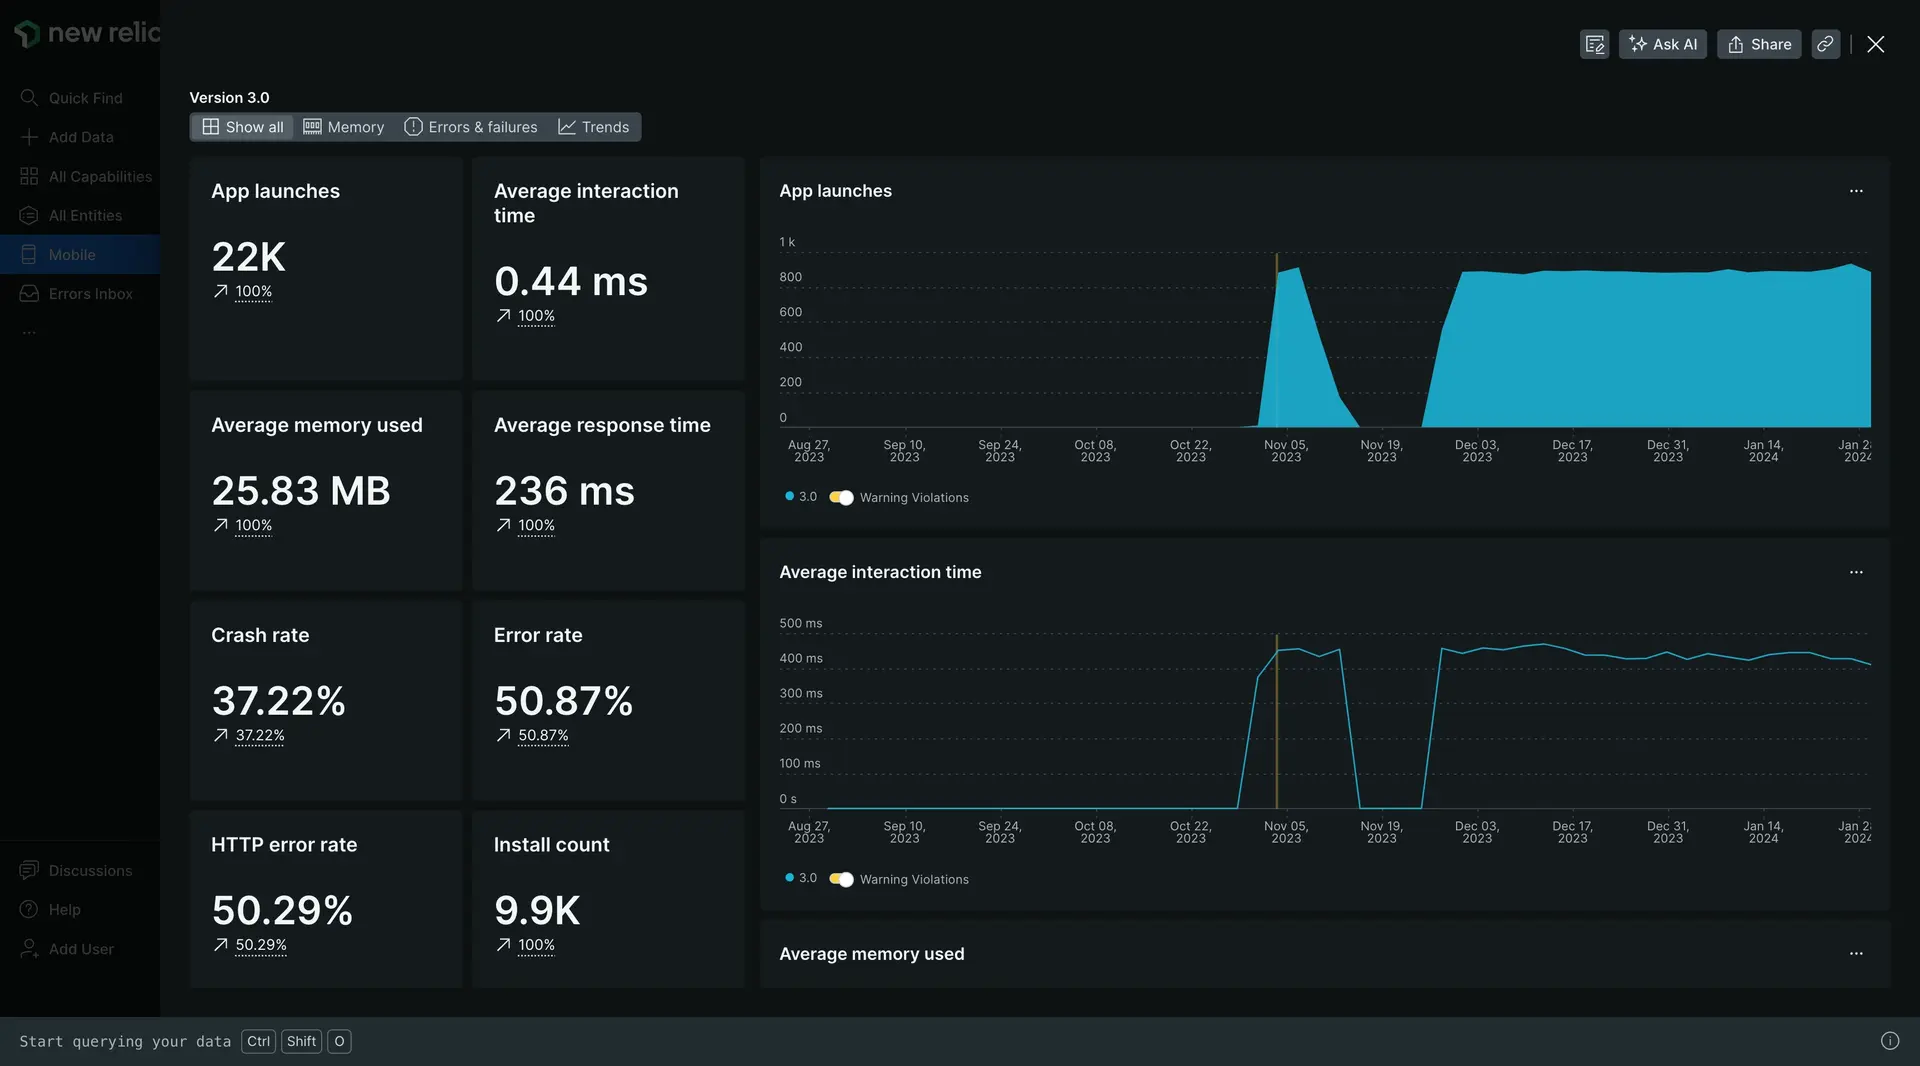
Click View summary or View details to expand into a specific metrics for an app version. With easy-to-understand visualizations and detailed charts, the version summary page empowers you to analyze key performance indicators and make informed decisions to optimize your app's user experience.

For each metric listed above, the Release versions page includes a dynamic time series chart, allowing you to track the metric's performance over time. By observing trends, spikes, or drops in the chart, you can quickly identify patterns and correlations that can inform your decision-making.
Create alerts
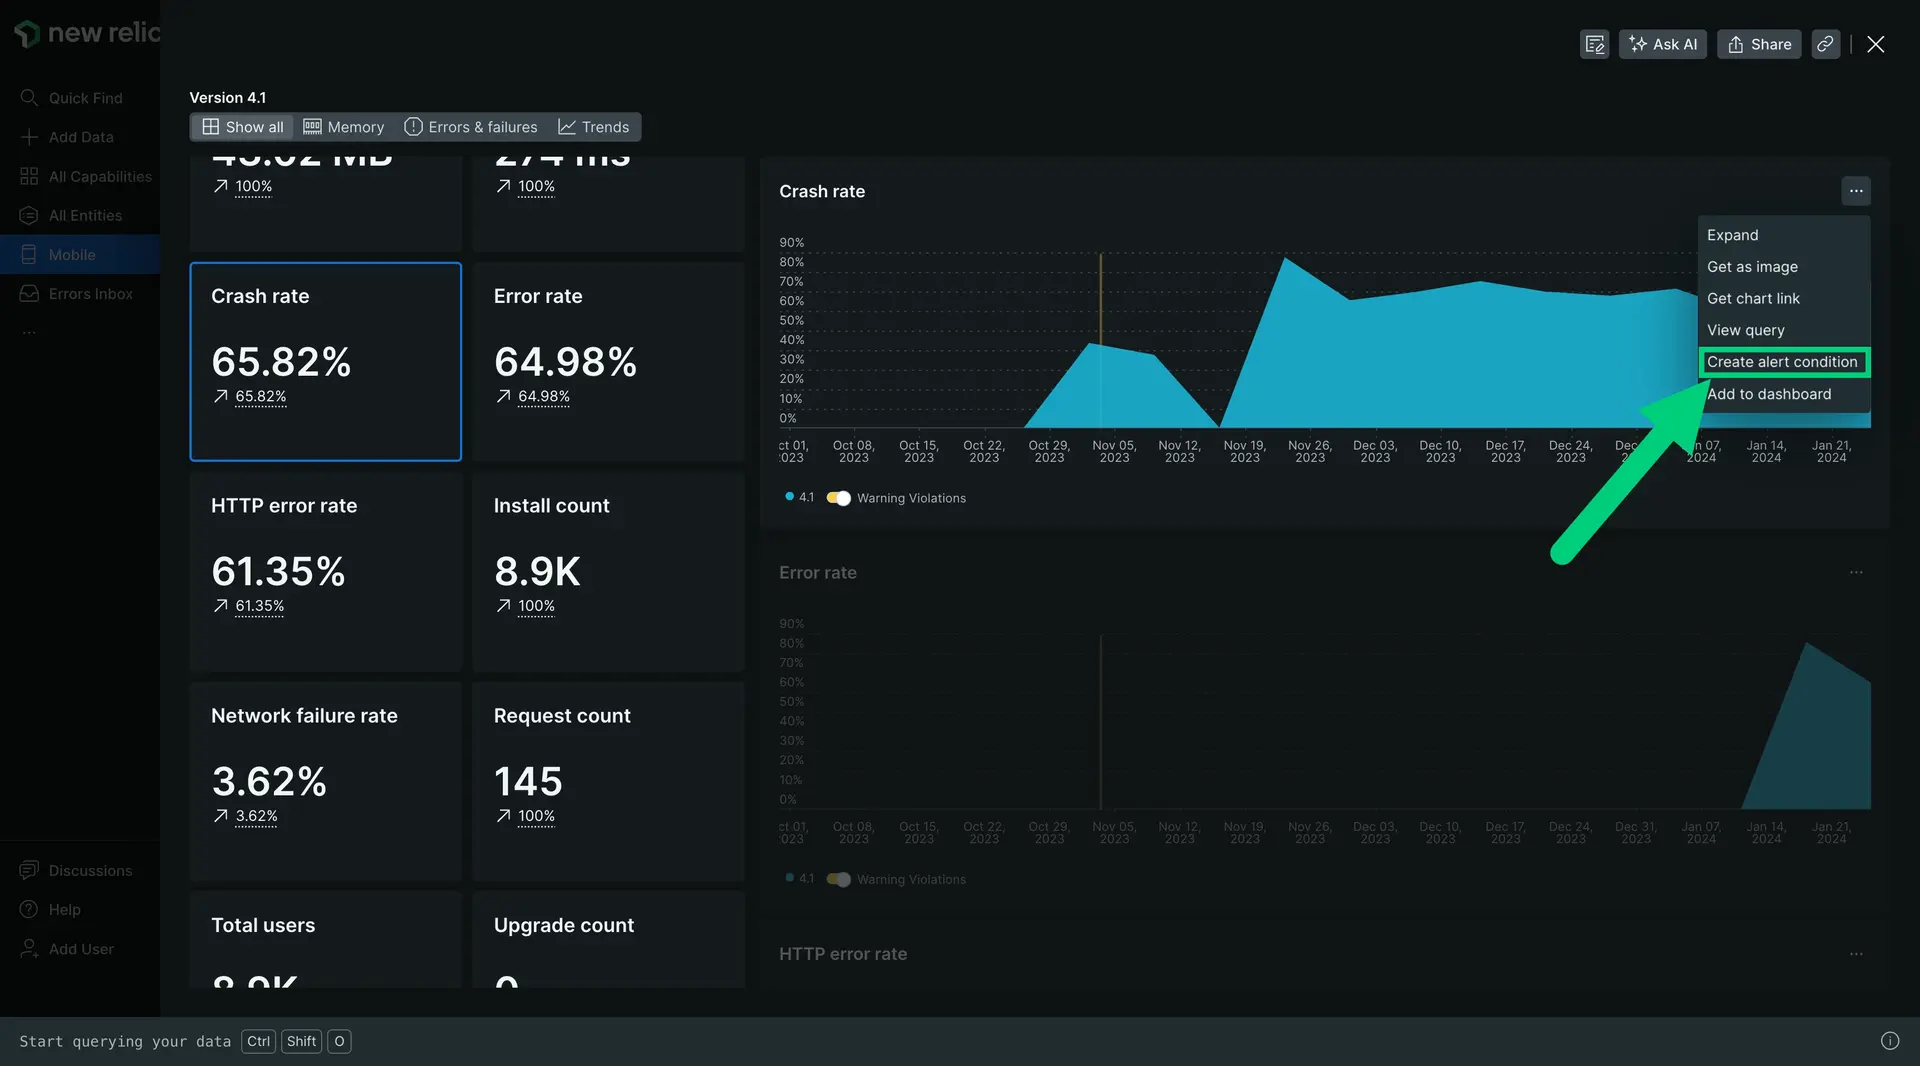
Now that you've got visibility into your app's performance, it's time to set up alerts for key performance changes.
Simply click into a metric, then from the chart menu, click Create alert condition and follow the steps in the UI.

Get release notifications via email
To set up release notification emails, see Release email notifications.