preview
We're still working on this feature, but we'd love for you to try it out!
This feature is currently provided as part of a preview program pursuant to our pre-release policies.
OpenTelemetry observability for Kubernetes provides complete, open-source setup paired with a top-notch Kubernetes UI that is already compatible with our proprietary Kubernetes instrumentation. Our Kubernetes UIs are designed to be provider agnostic, allowing you to select either OpenTelemetry or New Relic instrumentation based on your needs.
This document outlines the process for monitoring a Kubernetes cluster using OpenTelemetry. It involves the installation of the nr-k8s-otel-collector Helm chart within the cluster and the deployment of the necessary Collectors to enable first-class observability.
By integrating Kubernetes components into the OpenTelemetry Collector, we can transmit metrics, events, and logs directly to New Relic. These telemetry signals automatically enhance our out-of-the-box experiences such as the Kubernetes Navigator, overview dashboard, Kubernetes events, or Kubernetes APM summary page.
How it works?
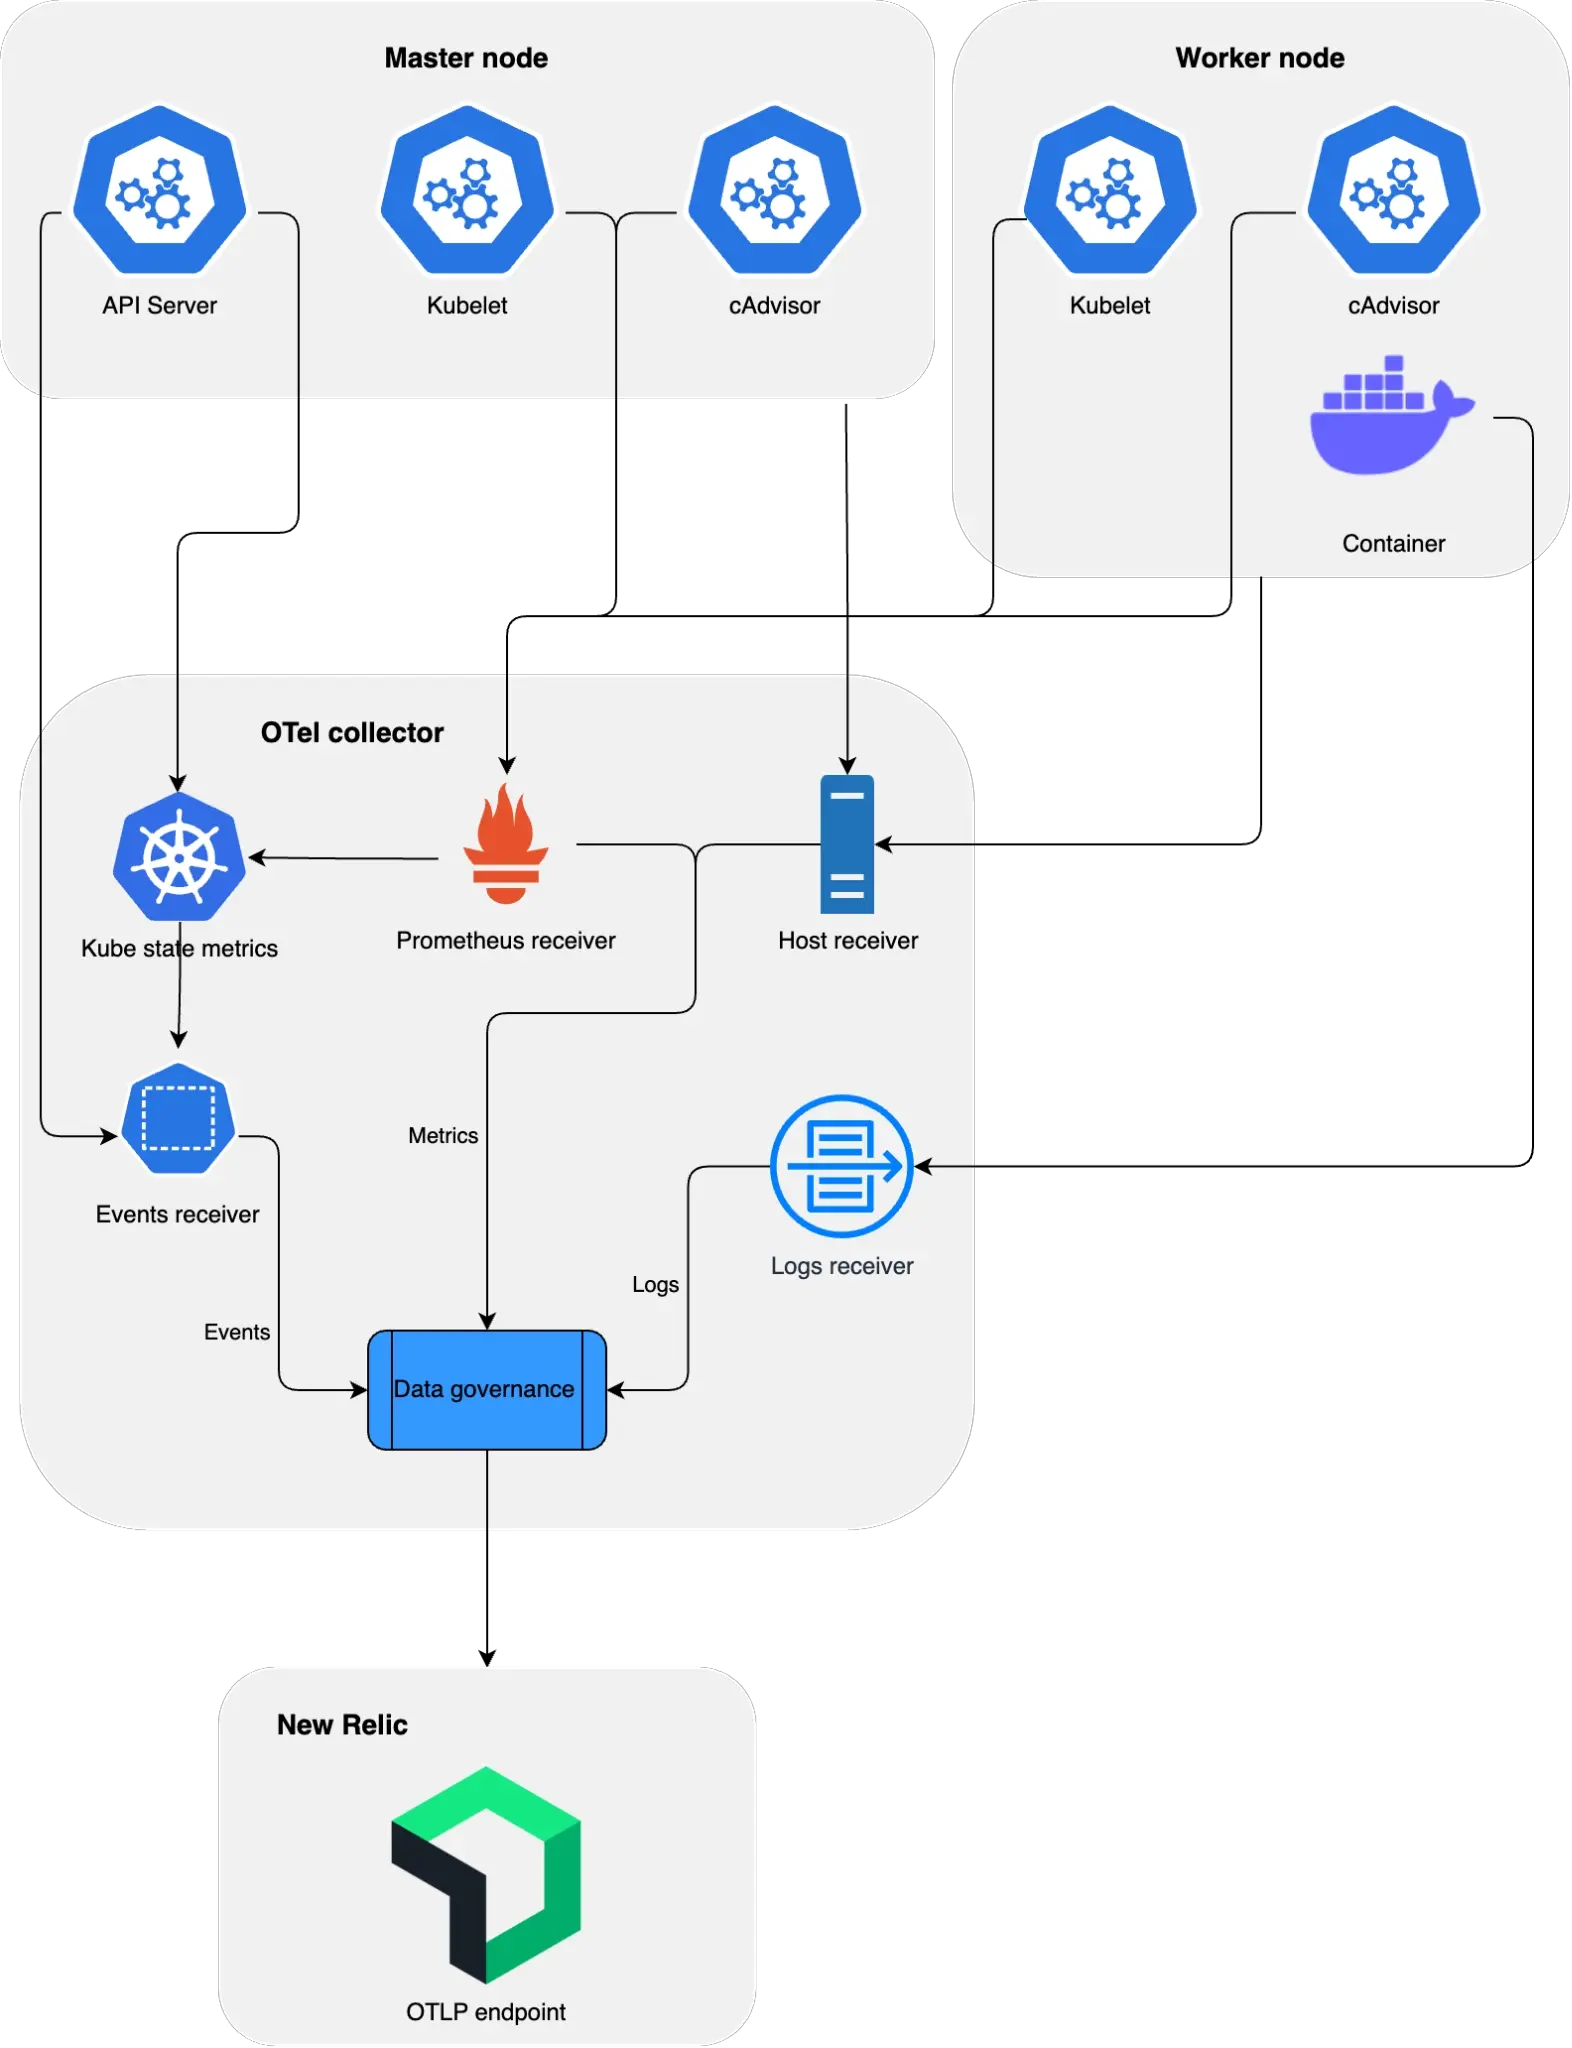
The nr-k8s-otel-collector Helm chart deploys these OpenTelemetry Collectors:
Deamonset Collector: Deployed on each worker node and responsible for gathering metrics from the underlying host in the node, the
cAdvisor, theKubelet, and collecting logs from the containers.Deployment collector: Deployed on the control plane node and responsible for gathering metrics of Kube state metrics and Kubernetes cluster events.

Requirements
To send Kubernetes telemetry data to New Relic, we need an OpenTelemetry Collector. Our New Relic distribution of OpenTelemetry (NRDOT) is already set up to automatically monitor a Kubernetes cluster. It does this by deploying all the necessary components through our nr-k8s-otel-collector Helm chart.
If you switch to a different OpenTelemetry Collector, make sure it has all the key components you need:
- Attributes processor
- Filter processor
- Filelog receiver
- GroupByAttrs processor
- Hostmetrics receiver
- K8sAttributes processor
- K8sevents receiver
- Kubelet receiver
- MetricsTransform processor
- Prometheus receiver
- ResourceDetection processor
- Resource processor
- Transform processor
Sugerencia
Interested in using our Kubernetes OpenTelemetry observability, but don't want to install our Helm chart?
- Make sure that your Collector includes the previously highlighted components.
- Follow the setup instructions provided in this document to configure your collector appropriately.
Install your Kubernetes cluster with OpenTelemetry
To get OpenTelemetry up and running in your cluster, follow these steps:
Download the Helm chart values file adapt it to meet your specific requirements.
Cluster name and are mandatory.
Check the entire list of configuration parameters.
Install the Helm chart together with the values file.
bash$helm repo add newrelic https://helm-charts.newrelic.com$helm upgrade nr-k8s-otel-collector newrelic/nr-k8s-otel-collector -f your-custom-values.yaml -n newrelic --create-namespace --installEnsure the pods have been successfully spun up.
bash$kubectl get pods -n newrelic --watchMake sure New Relic is getting the data it needs, including metrics, events, and logs, by running the right queries. See Introduction to the query builder for more information.
FROM Metric SELECT * WHERE k8s.cluster.name='<CLUSTER_NAME>'FROM InfrastructureEvent SELECT * WHERE k8s.cluster.name='<CLUSTER_NAME>'FROM Log SELECT * WHERE k8s.cluster.name='<CLUSTER_NAME>'If you're using a GKE AutoPilot cluster, it's necessary to apply the following configuration in your
values.yamlfile to ensure compatibility and proper functionality of the OpenTelemetry Collectors.gkeAutopilot: true
Uninstall your Kubernetes cluster with OpenTelemetry
To stop monitoring a Kubernetes cluster with OpenTelemetry, run this command:
$helm uninstall nr-k8s-otel-collector -n newrelicReduce data ingest
The LowDataMode option is enabled by default to ingest only the metrics required by our Kubernetes UIs.
If you need to cut down even more on data ingestion, increase the scrape interval in the nr-k8s-otel-collector chart values for each deployed component.
Metrics
Find and use data
Check out these documents to learn more on how to find data:
Explore your Kubernetes cluster to know the status of your cluster, from the control plane to nodes and pods.
Kubernetes APM summary page which offers insights into your Kubernetes integration alongside your monitored applications.
Troubleshooting
Check out the logs of the Collector pod that's experiencing issues. Run this command:
$kubectl logs <otel-pod-name> -n newrelicYou can also set the verboseLog parameter to true in the nr-k8s-otel-collector Helm chart.
Common errors
Check out the Common errors section in our GitHub repository.
Support
If you have issues with the OpenTelemetry observability for Kubernetes:
- Have a look at the issues section on GitHub for any similar problems or consider opening a new issue.