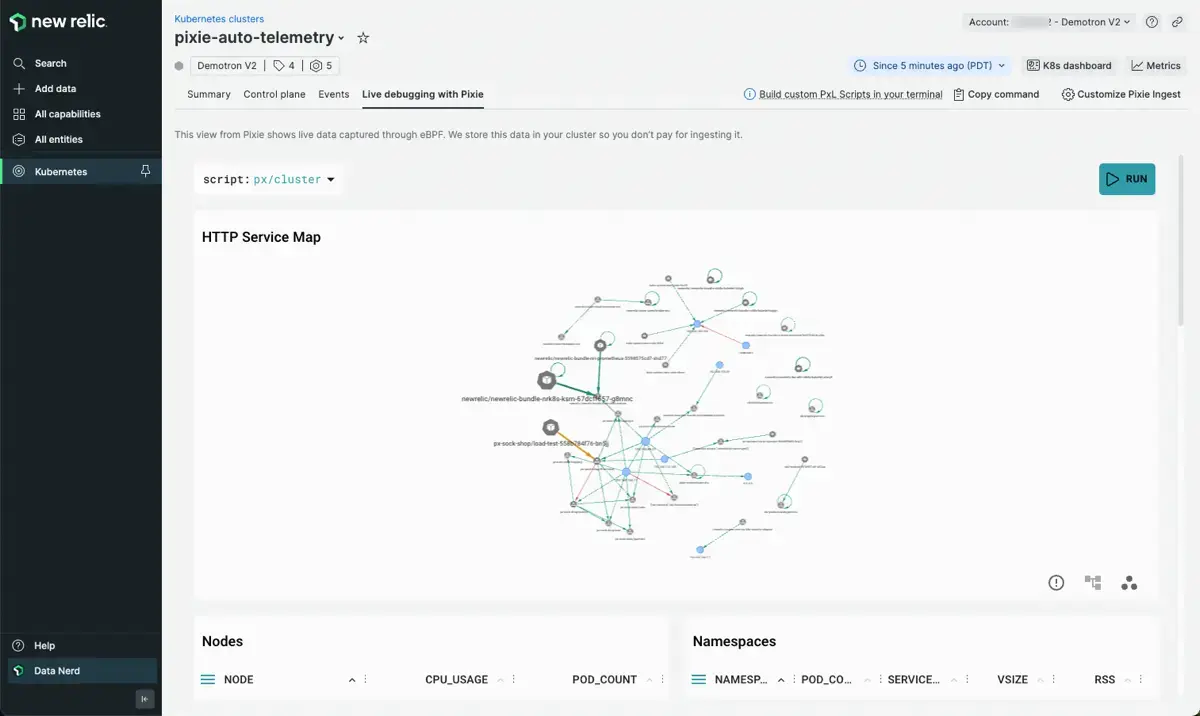
Use the Live debugging with Pixie tab to query the full set of telemetry data that Pixie collects in short-term storage on your cluster.
Find out more about the hybrid storage model for the New Relic Pixie integration here.

The Live Debugging with Pixie tab in the Kubernetes cluster explorer.
The Live debugging with Pixie tab contains an embedded view of the Pixie UI. Views in Pixie are powered by PxL scripts — scripts written in Pixie's PxL language — to query and visualize the telemetry data captured by eBPF.
Pixie provides many open source PxL scripts which enable you to debug:
- Traffic in multiple formats: HTTP and HTTPs (including encrypted), DNS, Postgres, MySQL, Cassandra, Redis, Kafka. Learn more: Request tracing tutorial.
- Database request performance. Learn more: Database query profiling tutorial.
- Service maps to learn which services are talking to each other. Learn more: Service performance tutorial.
- Network traffic maps to learn which nodes are talking to each other. Learn more: Network monitoring tutorial.
- Resource usage by Node and Pod. Learn more: Infra health tutorial.
- Spikes in CPU utilization. Learn more: Continuous CPU profiling tutorial.
Run a PxL script
Importante
For best results, select 5 minutes in the time picker when using the Live Debugging with Pixie tab. To examine less recent Pixie data, check out the Explore Pixie data section.
To run a script in the Live debugging with Pixie tab:
- Select a script from the
scriptdrop-down menu. - Fill in any required script arguments. Required arguments are denoted with an
*next to the argument name. - Run the script using the
RUNbutton in the top right or by using the keyboard shortcut:ctrl+enter(Windows, Linux) orcmd+enter(Mac).
Follow script deep links
Views in Pixie contain deep links that allow you to easily navigate between Kubernetes entities.
For example, the Nodes table in the px/cluster script (pictured above) outputs a list of all of the nodes in your cluster. Click on a node to be taken to the px/node script for that particular node. The px/node script shows an overview of a particular node’s pods, CPU and memory usage, and network traffic.
Modify a PxL script
To learn how to modify an existing PxL script or write your own custom PxL script, check out this demo.