CodeStream automatically flags performance problems in your code, allowing you to proactively address issues as they arise.

CodeStream identifies performance issues by starting with transactions and looking for anomalies in either error rate or average duration. If you're using New Relic's change tracking to send deployment information, anomalies are calculated by comparing the performance since your last release against the preceding three weeks. Otherwise, the comparison is made using the last seven days. For any transactions identified as having performance issues, CodeStream then drills down into the segments (e.g., database queries, external calls, individual methods, etc.) that make up the transaction to see if any of them are performing poorly. This allows you to hone in on the source of the problem.
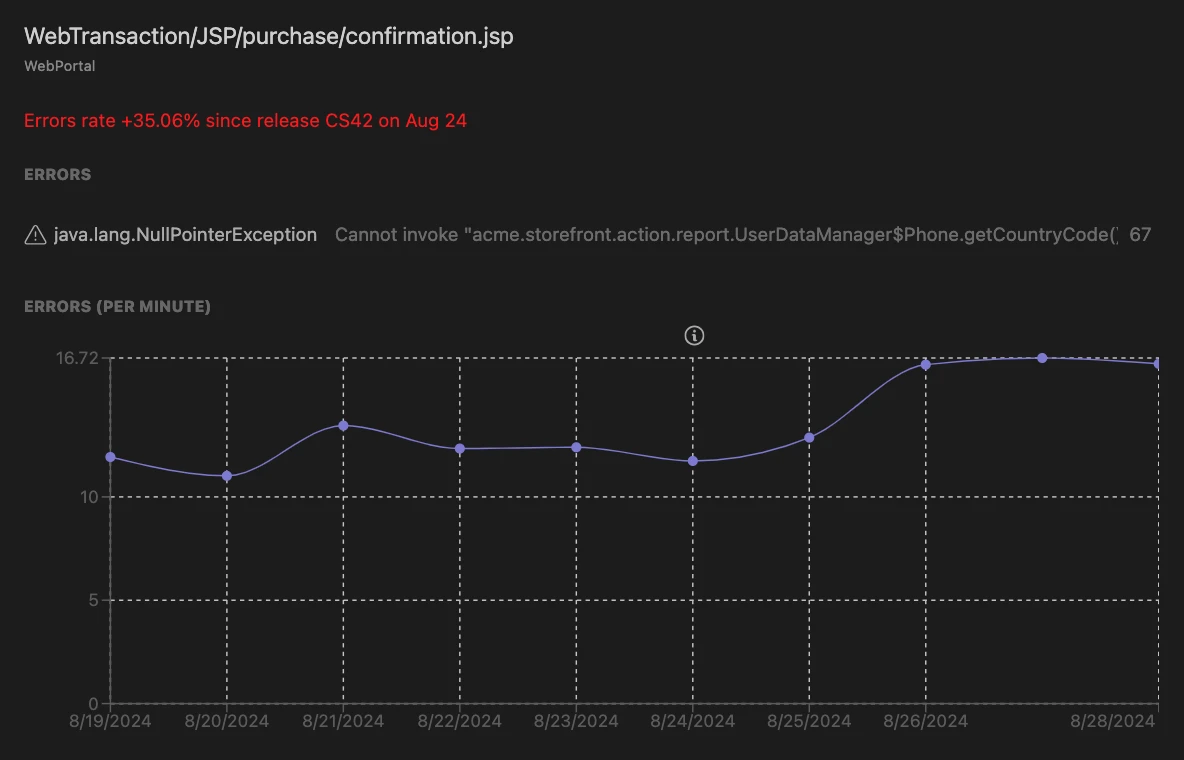
Click on any transaction or segment to see the performance issue charted over time. For anomalous error rates, the errors contributing to the increased error rate are listed and you can click on one to go into CodeStream's error investigation experience.

For anomalous average duration, CodeStream does a critical path analysis to list the slowest operations. And for anomalous database operations, the actual queries are listed.