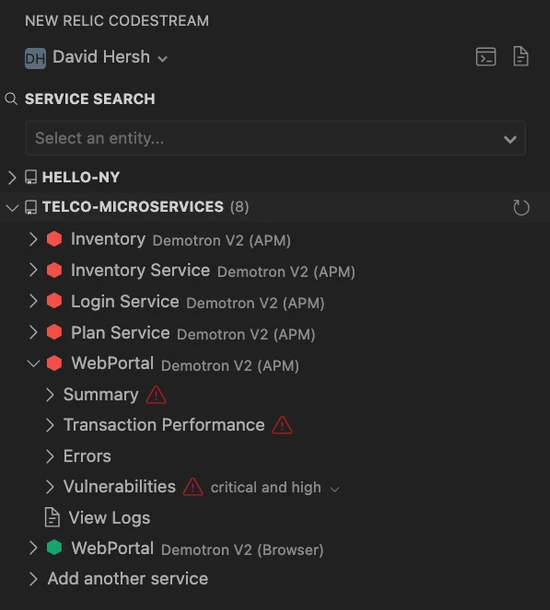
New Relic CodeStream allows developers to see how the code they're responsible for is performing in production by bringing observability into the IDE and making it part of their daily routine.
The observability data displayed in CodeStream is contextual to the repositories you have open in your IDE. If those repositories aren't associated with services on New Relic, you will be prompted to make those associations. Otherwise, you'll get a comprehensive view of how the services built from your code are performing.

For each service, the following performance data may be displayed:
- Golden metrics: The key signals indicating how your service is performing. The metrics vary based on the type of service (APM, Browser, Mobile, OTel, Lambda functions).
- Issues: Any open issues based on the alert conditions configured for the service (APM only).
- Service-level objectives: A summary of how the service is performing against any configured service-level objectives (APM, Browser, OTel).
- Transaction performance: See which transactions are exhibiting performance issues since your last release. Learn more about transaction performance (APM only).
- Errors: Recent errors happening in the code you're responsible for. Click on an error to step through the stack trace and collaborate with teammates on the investigation. Learn more about error investigation (APM, Browser).
- Vulnerabilities: Package-level vulnerabilities, including information on how to remediate (APM only).
- Related services: All of the services that call or are called by your service, with the ability to see the golden metrics for each of them. Understand how your service fits into the bigger picture (APM, Browser, Mobile, OTel).
- Logs: Search logs directly from your IDE to avoid context switching. Learn more about log search (APM, Browser, OTel).
When hovering over a service name in the tree, click on the globe to open the service's summary page on New Relic.
To use the observability features in CodeStream, note that you must have a New Relic user type of core user or full platform or you must be on the New Relic Compute pricing model.