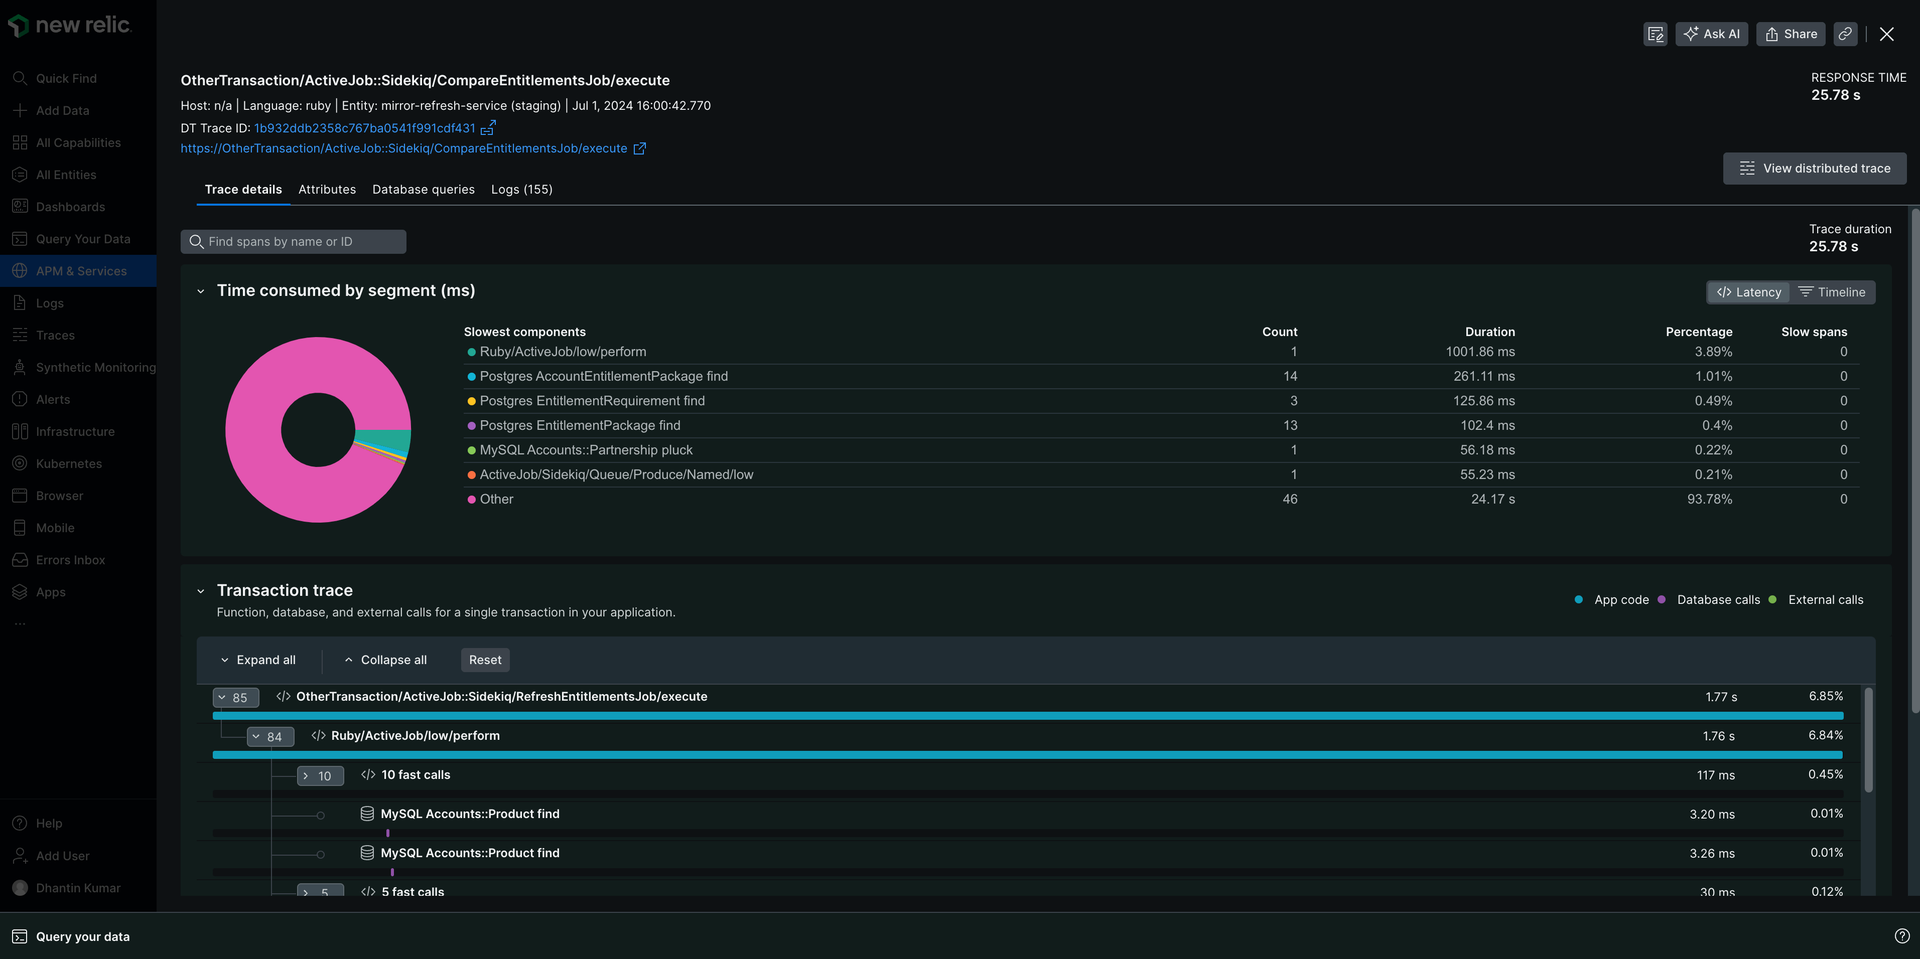
A transaction is a grouping of function and method calls that comprise a single work unit. Transactions often map to a URL, but not always. In , you can view all of your transactions for a particular entity under the Transactions tab. If you click on a specific transaction under the transactions tab, you'll see data for all users across all time.
But if you want to learn more about what happened for a specific user during a specific instance, you need to use Transaction traces. With the Trace details tab, you can:
- Identify slow segments: Segments that took over 25% of the total trace time are marked as "slow spans," directing attention to potential bottlenecks.
- Visualize your transactions: See a graphical representation of the transaction's timeline that showcases the duration of different segments like database calls, external calls, or code execution.
- Efficiently troubleshoot: Filter your data to focus exclusively on slow spans.
How it works
Selecting a specific transaction in the Transactions tab will open the Transaction details tab. From there, select a transaction in the Transaction trace table to open the Trace details page. The Trace details page provides an intricate deep dive into one user's experience with a transaction in a single instance. Explore your data using one of three views: timeline, latency, or waterfall.

Go to one.newrelic.com > All capabilities > APM & services > (select an app) > Monitor > Transactions > (select a transaction trace) > Trace details.
The trace timeline view contains an interactive condensed visual display of the trace. The node color presented in this view matches the waterfall legend for each segment's category.
Hovering over nodes in this view will display the segment name above the timeline. Clicking on a node within this view will select the same node in the waterfall and open the segment details pane. A horizontal drag on this view will filter the nodes presented in the waterfall to those that occur within the selected window. You may change the filtered window by manually moving the green scrubbers or clicking the Reset timeline button.

Latency view
The Latency View section provides insights into the six slowest services or components contributing to the overall trace duration, along with their individual contributions and slow node counts.
Key things to note:
The reported duration of a service is the sum of the exclusive duration for all nodes originating from that service.
Clicking a service from a pie chart or table will select the waterfall's first node from that service.
When more than 6 services contribute to a trace, a category labeled Other may exist, which contains rolled-up data from all services in the trace, excluding the slowest 6. The Other category does not respond to clicks in the table or pie chart.

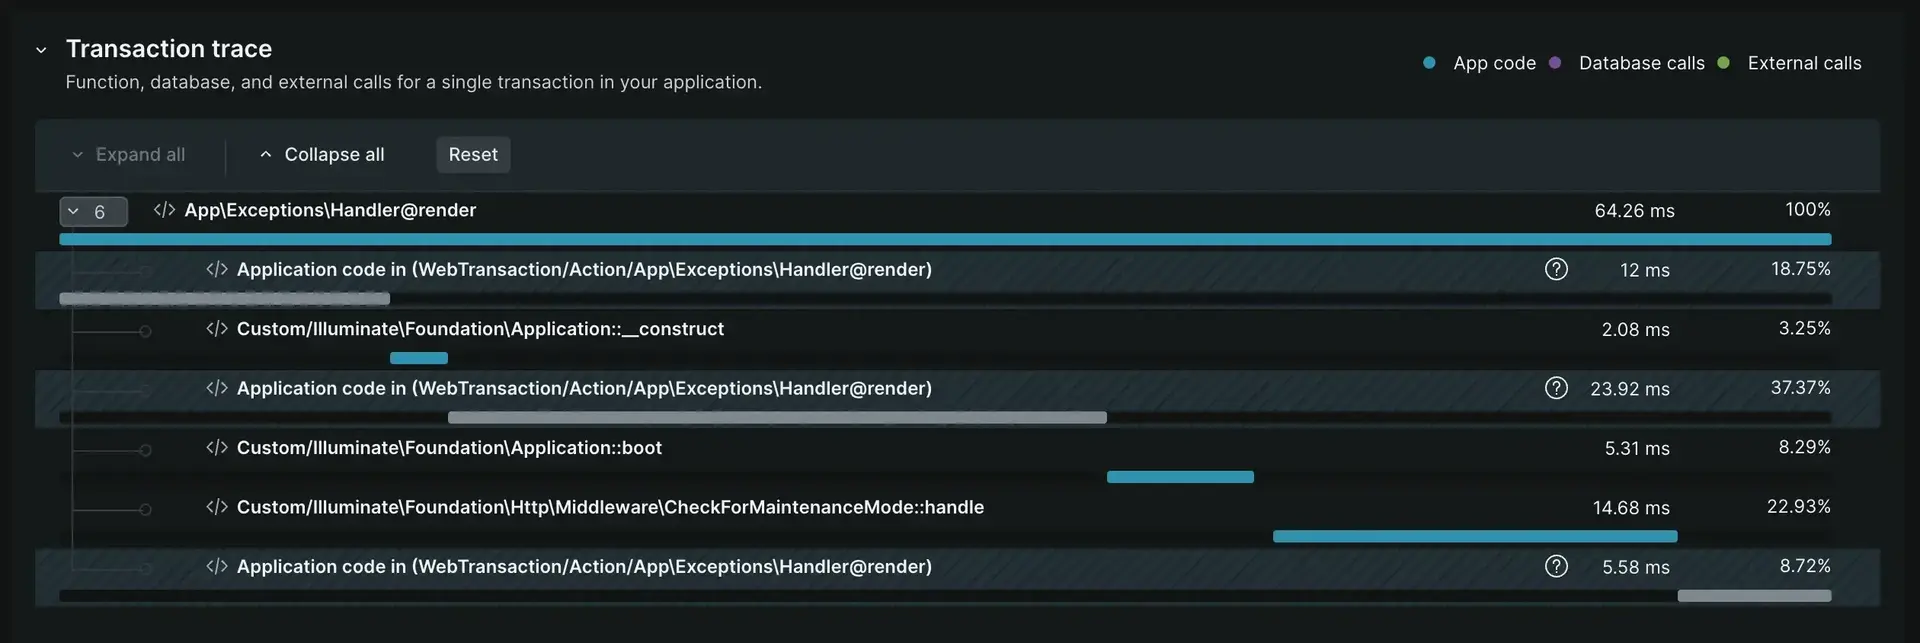
The waterfall displays a node tree of segments arranged into branches by call path. Each segment shows information about the originating service, including service name, segment type, and segment duration.
Navigating the waterfall
The waterfall view has several controls to make it easier to find segments that you care about:
Expand/Collapse: Easily show or hide individual segments or entire branches with the arrows.
Focus on slow spans: If your trace has slow spans, click the checkbox to filter out other segments and focus on potential bottlenecks instantly.
Legend: Click on any color in the legend to see details about segments belonging to that service category.
Waterfall legend
The waterfall is divided into different segments:
Yellow: More than 25% of the total transaction time was spent in this segment.

Striped: Segments with classes and methods not instrumented with the agent's current configuration.

Each segment in the waterfall displays a bar representing its duration relative to the trace duration. The color of this bar indicates whether the segment belongs to application code, database calls, or external calls.

Waterfall segment properties
These icons can identify each segment:
Segment property
Indicator
Description
Service

This icon represents a node that's a service's entry point.
In-process

This icon represents an in-process node, which is a node that occurs within a process (as opposed to a cross-process node). Examples include middleware instrumentation and user-created node.
Datastore

This icon represents a segment call to a datastore.
External

This icon represents a category representing a call to an external service made via HTTP.
Browser app

This icon represents a browser application segment.
Lambda

This icon represents a node from a Lambda function.
Waterfall segment grouping rules
New Relic automatically groups fast and repeated method calls within the waterfall to make complex transaction traces easier to understand. Grouping segments helps you focus on potentially problematic areas without getting overwhelmed by too many segments.
Here's how it works:
Fast calls: When you see a segment titled
fast calls, it means New Relic has grouped multiple calls completed quickly (under 7.5 ms each). These are usually not performance concerns, but you can expand the group to view individual segments if needed.Identical Calls: Four or more consecutive identical calls often indicate an N+1 problem, so New Relic collapses them to highlight the potential issue. Expanding the collapsed group reveals the first three calls for analysis.
Dive deeper into your data
Slow spans
A node that is marked as a Slow span meets the following criteria:
- The segment is a leaf or exit node, meaning that this node will have no children.
- The segment has an exclusive duration greater than or equal to 25% of the total trace duration.
Application code in traces
If a segment is listed as Application code in the table, it indicates that that section of code was not instrumented. You can use custom instrumentation to get more detail on that part of the code. Segments are often listed as Application code for partial traces.
Partial traces
For performance reasons, APM only captures the first 2,000 segments of a transaction trace (900 for Node.js). If a transaction trace exceeds that number of segments, the agent truncates the transaction trace and displays a message at the top of the Details page:
This is a partial trace.
The APM agents have differing rules for when to truncate segments.
APM agent | Truncate segment rules |
|---|---|
Go | The segment duration must be greater than the |
Java, .NET, Ruby | These agents truncate traces chronologically. For more information, see the transaction tracer documentation for Java, .NET, or Ruby as applicable. |
Node.js | The Node.js agent only captures the first 900 segments of a transaction trace. For more information, see Node.js transaction tracer configuration. |
PHP | Truncates based on segment duration; the slowest 2,000 segments are captured for the trace. For more information, see PHP transaction tracer configuration. |
Python | Truncates based on segment duration; the slowest 2,000 segments are captured for the trace. For more information, see Python transaction tracer configuration. |
Distributed traces
When a transaction trace is based on distributed trace data, you can view the full distributed trace by clicking on the distributed trace link in the page header.
Things to keep in mind:
- All attributes are grouped into a single
Attributessection rather than split into the three default attribute types. - Segment metric names may differ slightly between distributed traces and transaction traces.
- Stack traces are not displayed in segment attributes.
- The trace details page will display slightly different information when you look at a distributed trace instead of a transaction trace.
Troubleshoot with segment details
When you select a segment, a pane opens up with three separate segment detail pages. These tabs can help troubleshoot performance issues.
Performance tab:
- Visualize performance trends: charts showcase a segment's operation's average duration and throughput, revealing patterns and potential outliers.
- Compare and contrast: See how the performance of this specific segment stacks up against the average, pinpointing areas that might need attention.
Attributes tab:
- Explore further: Understand attribute meanings and potential troubleshooting implications. You can learn more using our data dictionary.
Details tab:
- Foundational information: View critical details like the segment's full name, data source, and relevant metadata. You can learn more in our distributed tracing docs.
- Tailored insights: Discover segment-specific information crucial for troubleshooting, such as the database query for datastore segments.
Logs tab:
- Examine logs: With logs in context, you can see log messages related to your transaction trace directly in your app's UI.
Segments display date based on the segment type. For example, a datastore segment's details will include the database query.