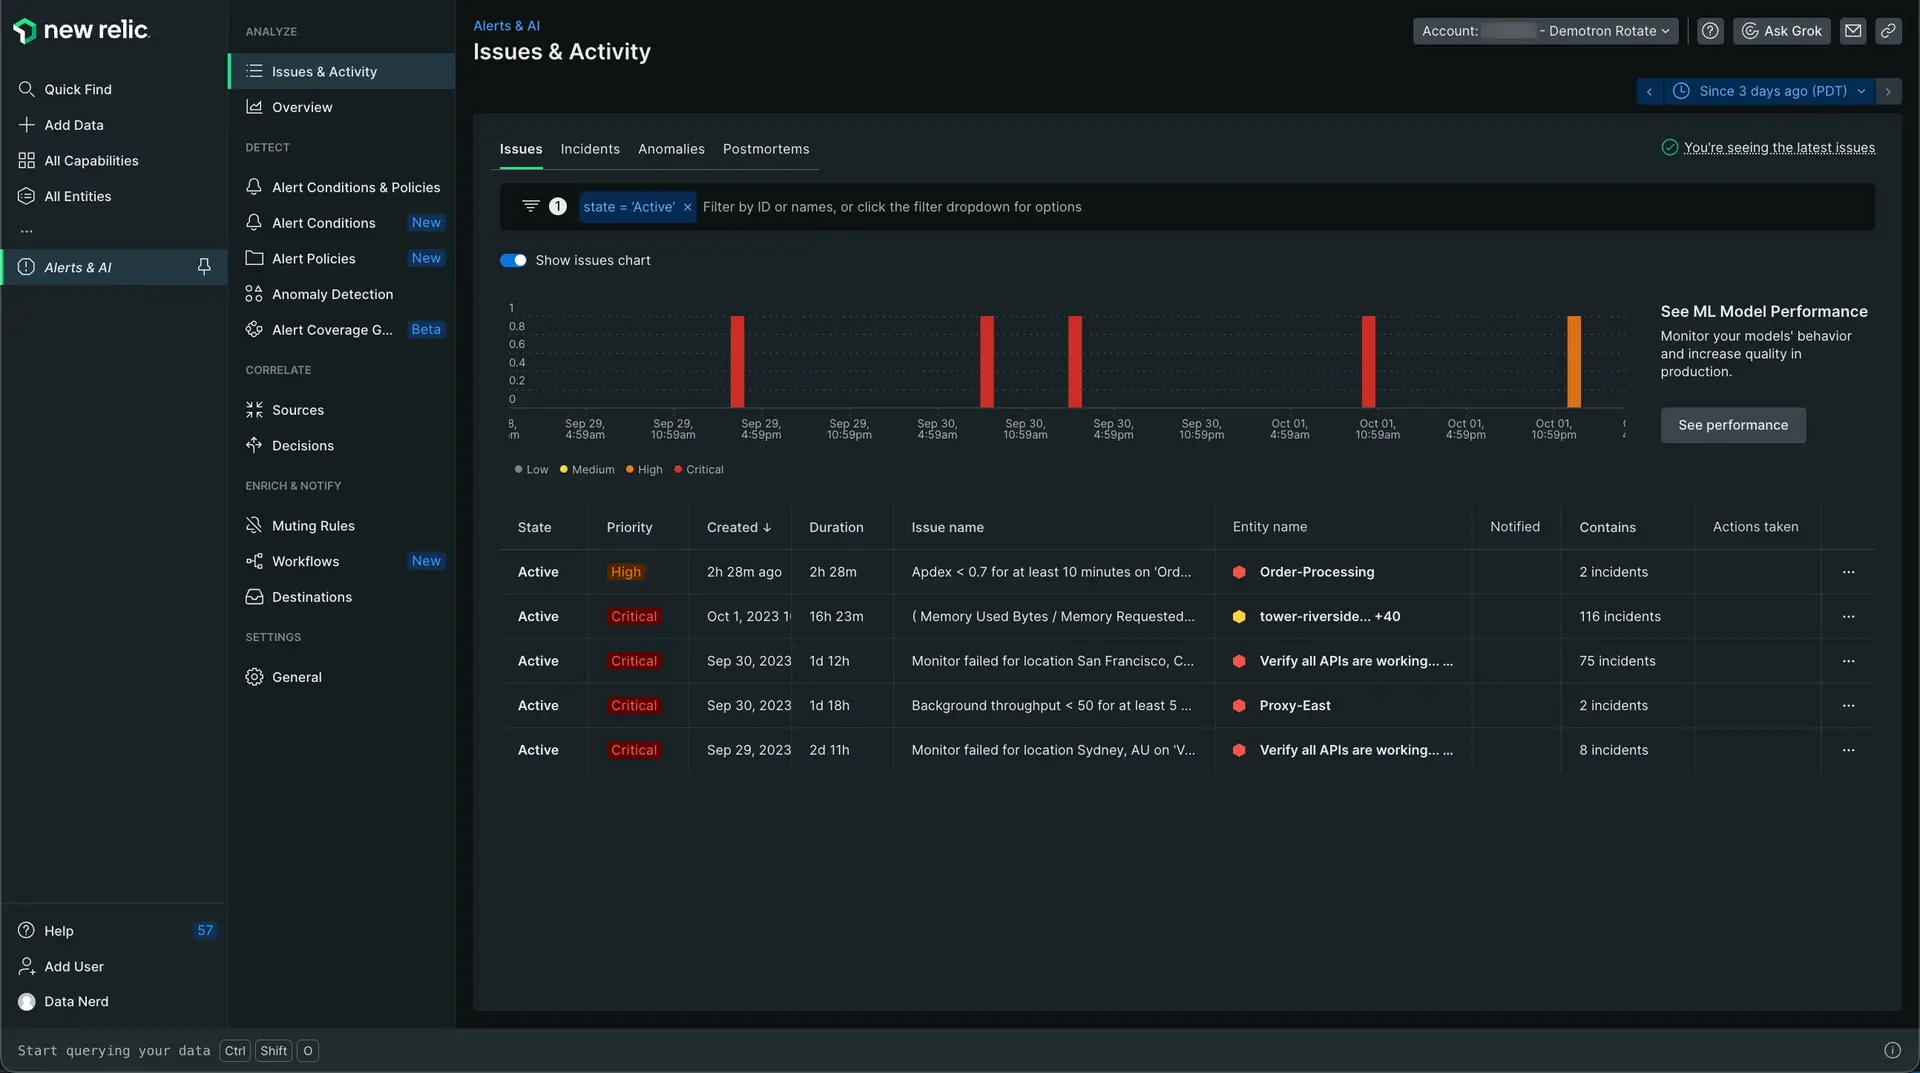
New Relic is a flexible system that allows you to get informed about issues for any entity or stream of telemetry data. You define the data to watch, the thresholds that if exceeded mean an issue, who is notified, and how. Alerts empower your team with dynamic tools to proactively detect and address potential problems. By pinpointing unusual activity, linking related issues, and aiding in root cause analysis, alerts enable swift action to keep your systems running smoothly.
New Relic's alerts help you to know what's critical, manage the suppressed noise, and mitigate alert fatigue.
With alerts, you can:
- Configure any signal to be evaluated against a threshold, or if it exhibits abnormal behavior.
- Organize alerts through tagging.
- Identify anomalies before they become broader issues.
- Route issues to the correct system or team using notifications.
- Enable the Predictive capability to anticipate and respond proactively to possible threshold breaches in the future. (Available with the public preview of Predictive Alerts).
New Relic alerts allow you to:
- Enrich your issue's notifications with additional New Relic data.
- Normalize your data, group related alert events, and establish relationships between them.
- Correlate incoming alert events.
- Provide a root cause analysis.
- Reduce and suppress noisy alerts.

To open view your alerts, go to one.newrelic.com > Alerts .
There are some steps you need to take in order to set up an alert condition and receive notifications. Check out our tutorial series for all steps you need to get started.
Want to get started making your first alert? See how to create your first alert.
Alerting concepts and terms
An alert event is generated when an active alert condition's threshold has been met. You can correlate similar or related alert events to an issue and group alert conditions together to create an alert policy.
You can configure notifications through Workflows to inform you about the triggering of alert conditions. These notifications include the option of sending them to various channels to reach the right group of people and help them triage the issue.
To get the most of alerting, it's essential to understand some basic terms and concepts.
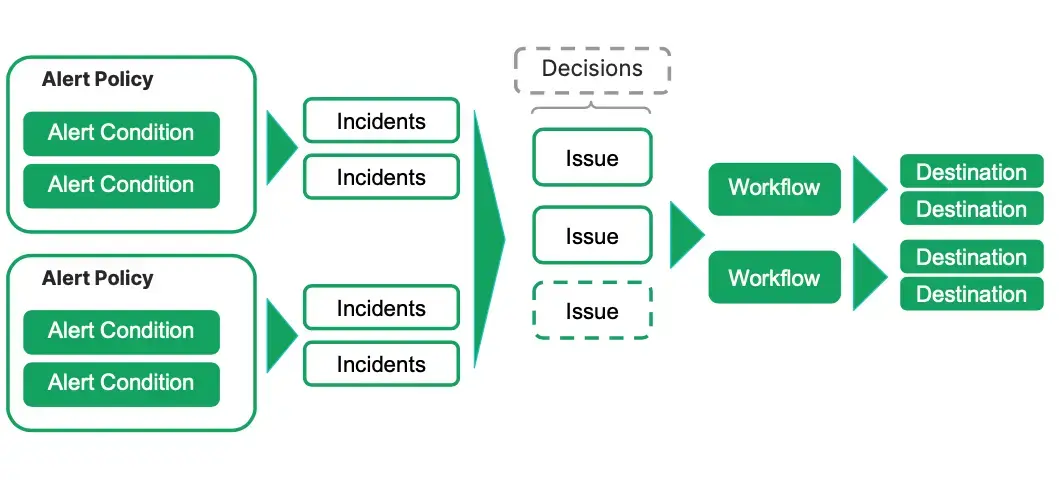
This diagram shows how alerts work: you create an alert policy that includes an alert condition or several alert conditions. Alert conditions include a defined threshold and when that threshold is breached, an alert event triggers. If you've configured a workflow, then you'll receive a notification. You can group alert events into issues and issues into decisions to have better management of your alerts.

Term | Explanation |
|---|---|
Configuration of one or more thresholds applied to a signal. An alert event is created when the thresholds are breached. | |
Logical operation that group alert events into larger issues. There are built-in decisions and you can also create your own custom decisions. | |
Service by which you get notified. It's a unique identifier for a third-party system that you use. | |
Indicate a state change or trigger defined by your New Relic alerts conditions or external monitoring systems. An event contains information about the affected entity. | |
Event generated when a condition threshold is breached. It's an individual event that details a symptom of a problem. | |
Collection of one or more alert events that requires attention and investigation and causes a notification. | |
Message that you receive when an alert event opens, is acknowledged, or closes. | |
Group of alert conditions that you configure to get notified when an alert event occurs. | |
Value that a data source must pass to trigger an alert event and the time-related settings that define an alert event. | |
Definition of when and where you want to receive notifications about issues. You can enrich your notifications with additional and related New Relic data. |
Ready to try New Relic for yourself? Sign up for your free New Relic account and follow our quick launch guide so you can start maximizing your data today! If you need any help, check out our tutorial series on creating alerts to get started.
Sugerencia
Do you use Datadog to monitor your logs but want to try out New Relic observability features for free? See our guide for migrating from Datadog.