preview
We're still working on this feature, but we'd love for you to try it out!
This feature is currently provided as part of a preview program pursuant to our pre-release policies.
With alerts' postmortems feature, events, metrics, and metadata are automatically collected to create a template you can use to run an alert event postmortem for your team.
What is a postmortem?
As you probably know, a postmortem is a retrospective process that teams use to analyze what worked and what didn't when responding to and resolving an alert event.
In the New Relic platform, the postmortem feature is a tool you can use to prepare a successful retrospective process for your team.
The postmortem includes:
- the record of an alert event, including descriptions
- a timeline of the alert event
- the alert event's impact
- the alert event's root causes
- mitigation measures taken by your team
- follow-up action items to prevent the alert event from recurring in the future
For a peek at how to build a postmortem with alerts, watch this short video (3:03 minutes):
Why use our postmortem tool?
Alerts postmortems automatically collect data related to an alert event, freeing up your team to focus on analysis and action items for improved responses to future alert events.
Ready to get started? Make sure you have a New Relic account. It's free, forever!
Create a postmortem
When an issue is closed, you can create a postmortem.
To find your issues, go to one.newrelic.com > All capabilities > Alerts > Analyze, and click Issues & activity.
Issues are groups of alert events related to the same underlying problem. When a new alert event is created, alert event intelligence may open a new issue and evaluates other open issues for possible correlation.
Follow these steps to create a postmortem.
Step 1: Enter postmortem page
From the issue feed, select an open issue for your postmortem.
To see your closed issues, in the search field, click the filter button, then select the Closed issue state.
On the issue detail page, click Close, and then click Create postmortem.
Step 2: Review, edit, and comment on timeline
A postmortem collects the events and metadata throughout the lifespan of an issue and automatically creates an event timeline.
Each event type is labeled with a different color to help distinguish them. Tags help provide useful additional context.
The event types include anomaly alert events, deployments, and user activity.
Each event in an issue is framed in an event card. You can review the timeline of events, delete an event card, or add a user event.
Step 3: (Optional) Add a user event
Sugerencia
To add a note as a user event on the timeline, move your mouse below any card, you will see an "Insert card" option.
Click on "Insert card", enter contexts, and save.
Step 4: (Optional) Comment on an event
For any event on the timeline, you can add comments.
Step 5: Review an event's metadata
Postmortem metadata includes associated issues and entities. These are automatically added to the postmortem. You can delete any associated entity that isn't relevant to you.
The time frame of the alert event is also included as metadata.
At the top of the postmortem page, select the severity level of the alert event. The severity is shown on the postmortem list page.
You can adjust the start and end time to reflect the actual time period of the alert event, if it's different than what's captured automatically.
Step 6: Fill out context sections

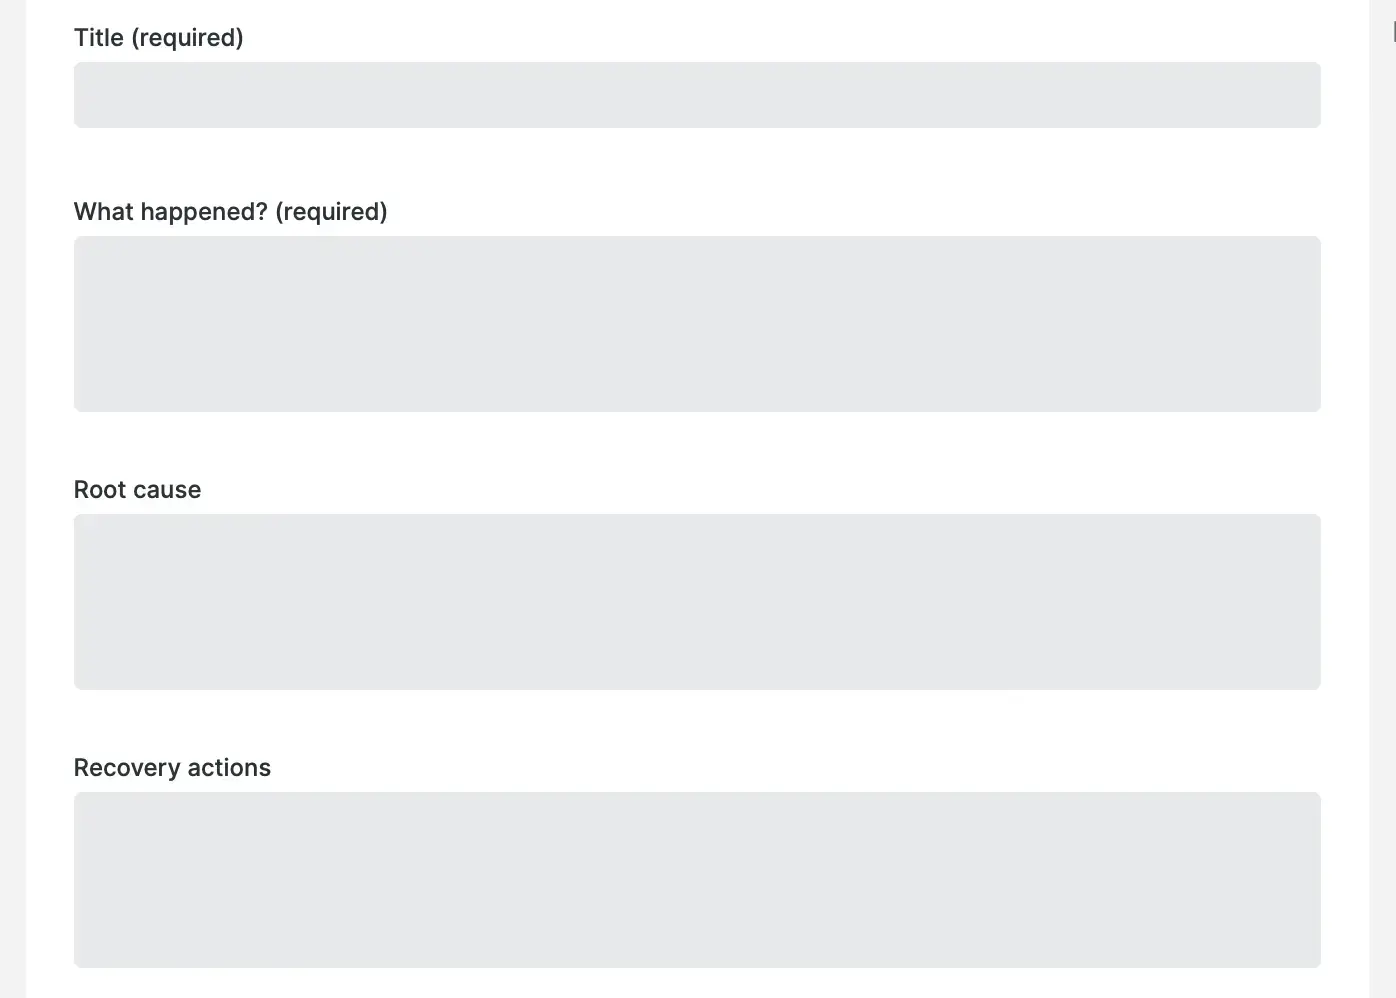
For a postmortem, the title and What happened summary sections are required fields.
The metadata sections and events timeline give you essential context about what entities are affected, when, and how.
Optionally, you can fill out the Root cause and Recovery actions sections to create a more detailed retrospective record.
View your postmortems
Once you've created one or more postmortems, you can return to them later. Follow these steps for a list of your postmortems.
Go to one.newrelic.com > All capabilities > Alerts > Analyze, and click Issues & activity.
Click the Postmortems tab.
Select an individual postmortem to look at the detailed postmortem record.
If you decide you no longer need a postmortem, on the detailed postmortem record, click Delete postmortem.