Now that you understand how to identify failure points in your system, it's time to move to the next layer of the troubleshooting process. Let's say that you've been notified that there's a problem with the underlying infrastructure that supports a team's apps. Building off the skills from Diagnose app failure with host data, you'll learn one way to compare data so you can make a decision about resource allocation.
Objectives
In this tutorial, you'll learn how to:
- Troubleshoot an alerting host with high CPU
- Make a data-driven decision about resource allocation
Investigate a sudden spike in CPU
Determine if there's a problem with your resources
Let's assume you have no additional context about the nature of the outage. Your first step is to determine if a change can be correlated to resources at all. Start at the summary page and evaluate your resource-related data: your CPU, memory usage, and disk utilization.
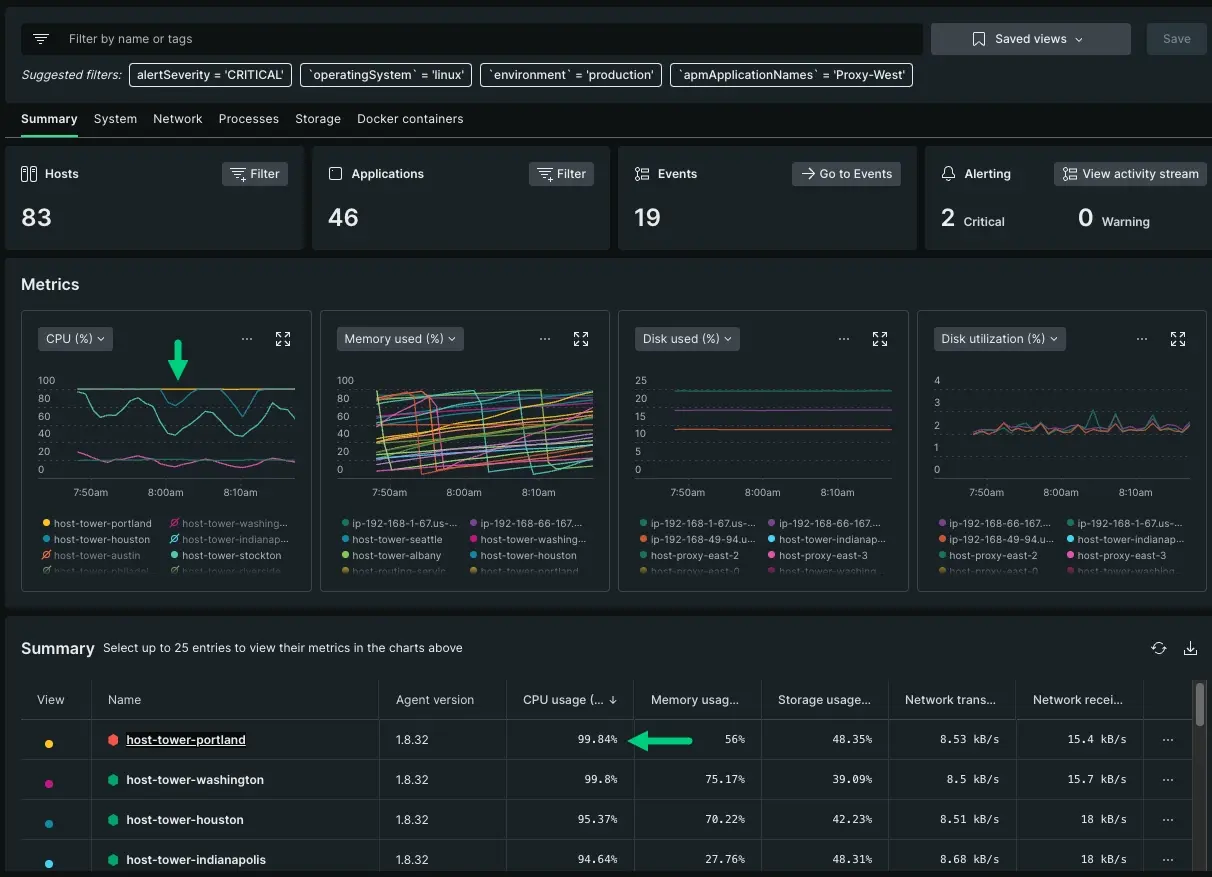
Using this screenshot as an example, you can infer that:
host-tower-portlandhas a critical alert event.From the summary table, you can see that the CPU is running hot at 99.84%.
The metrics graphs show you that this behavior has been ongoing for at least 30 minutes.
Since this behavior is unexpected, you'll want to dig deeper into that specific host.
Correlate your data
After clicking on a host, a new summary page appears with data specific to that host. At this stage, you're trying to elaborate on patterns identified from the summary page. Let's see if we can correlate CPU percentage with any other data specific to host-tower-portland.
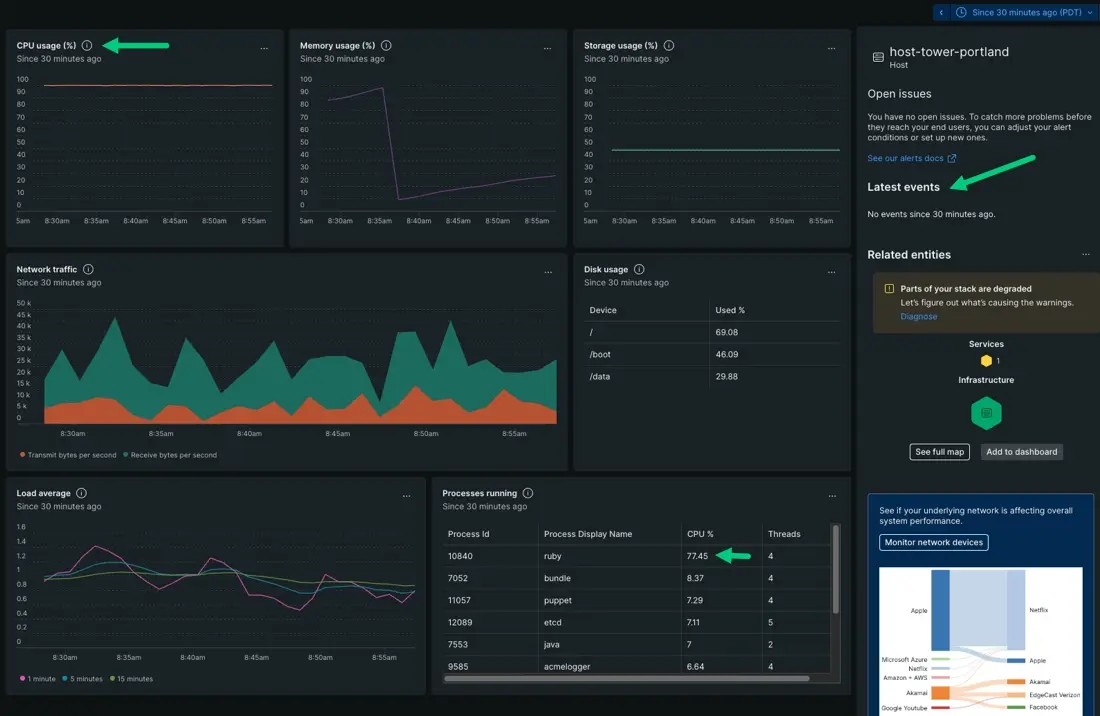
Since we're dealing with CPU percentage, we want to determine if the problem is app related or machine related. To do that, you want to check the Processes running table against the Latest events in the sidebar. This step disambiguates whether or not a problem is occurring because a change was made directly to the machine, or if a process is exhausting resources.
Based on this screenshot:
CPU usage is running hot and flatlining near 100%.
No events reported in the last 30 minutes, approximately when the change first occurred. If there were events reporting, you'd look for any change in the machine's config file or check whether someone has entered the machine to make changes directly.
There's a
rubyprocess using up 77.34% of your CPU.Because you've correlated CPU percentage with a process, you can conclude that an app is hogging your resources rather than the problem coming from the host itself.
Determine if you should allocate more resources to that app
A resource-related problem doesn't always mean the solution is provisioning more resources. There are any number of reasons for high CPU, but thse two big ones are:
The app is running a redundant process that's causing CPU to spike. If this is the case, you should reach out to the owning team about optimizing that app.
More end users are accessing that component and adding stress to your system. If this is the case, then you should provision more resources to meet that load.
If we look at the summary page for
host-tower-portland, we can identify which scenario applies to this situation by correlating time series patterns between different charts. Let's compare network traffic against your infrastructure metrics.In this case, you're expecting the Network traffic graph to trend similarly to your metric graphs for CPU usage, memory usage, and so on.
If your resources are related to app issues instead of load, then your network time series would trend in an ordinary way, that is without any spikes or troughs.
However, if load is the cause of high CPU, then you'd notice your network time series mirroring the trends across your other metric graphs.
Let's compare our CPU usage and Network traffic:
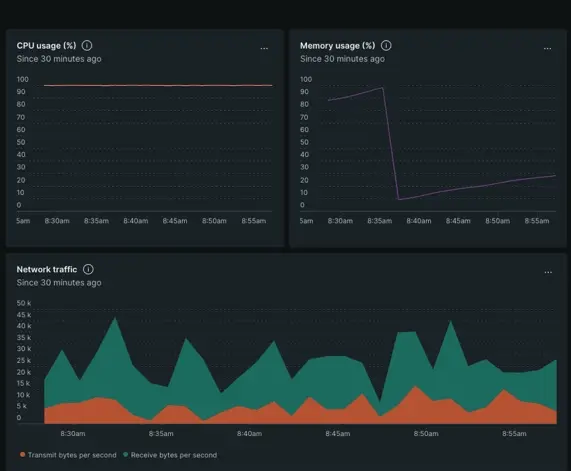
If load is stressing your system, your Network traffic would show an increase that paralells your metric graphs.
You might also notice a slow decrease of traffic over time after a peak. This is because resources are running out and causing those processes to stop. In other words, if available resources can't support demand, then network traffic might throttle and cause a steady decrease.
Network traffic, however, is showing consistent behavior. The overall behavior doesn't appear to change over time as resources run out. Instead, the time series shows regular peaks and troughs.
This indicates that the problem is actually with the app, rather than the app needing more resources to meet load.
In this instance, you would not allocate additional resources to the app. Instead, reach out to the owning team and recommend they optimize the offending Ruby process.
Share with the team
When you make recommendations to other teams, you want everyone to look at the same data. This ensures that when decisions are made for potential changes, those decisions are based on the same data used in troubleshooting.
In the previous steps, we've applied filter queries to display specific sets of hosts related to a problem. This updates the summary page data, which you can save for other teams.
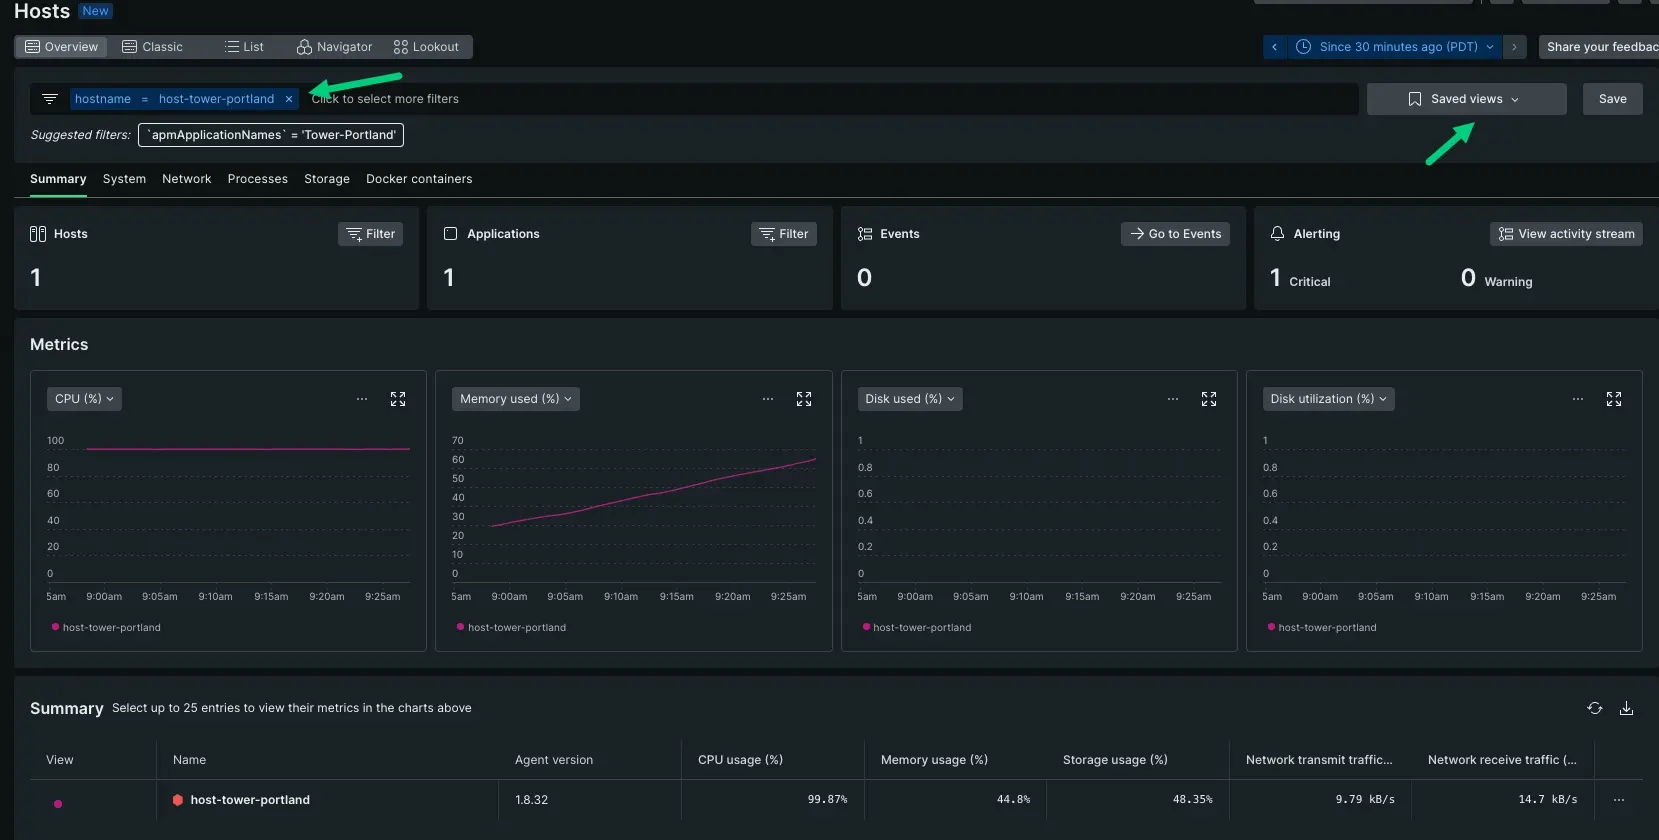
Determine how much data the other team might need to do their job. Maybe there are sets of hosts that should be accounted for, or maybe they only need one slice of example data.
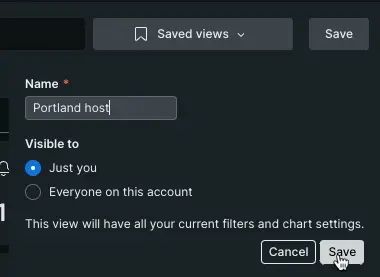
Create a filter that displays only the relevant data. For the sake of simplicity, the saved view includes one host from the filter
hostname = host-tower-portland. One other possibility is to filter down by app names, or maybe by alert status.Name the view, then click Save.
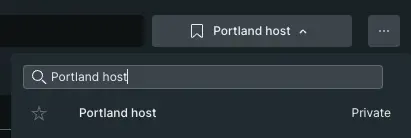
Once you've created a data view, it's time to save that view so it's searchable by other teams. When they're troubleshooting their own app behavior, they can find the view by searching the dropdown.
What's next?
So far we've covered how to use infrastructure data to troubleshoot a resource-related alert event. We've covered how to scope down from thousands of hosts to a set of hosts, then correlated data to make a decision. The next doc shows you how to create custom dashboards using infrastructure metrics.
